Scotland's economic performance - comparative research
This paper explores Scotland's economic performance relative to other geographies. To allow comparable international benchmarking the majority of the analysis is based on data from Eurostat and OECD databases. The indicators used in this analysis were determined by international data availability. They focus on: economic output; disposable income; employment; productivity; innovation; income inequality; and entrepreneurship.
Executive Summary
This paper's overall verdict based on available comparable data is that Scotland's comparative economic performance is 'medium - high' relative to European nations and regions.
The indicator analysis in this paper illustrates the extent of regional variations within countries, which is often lost in high-level country level figures. Regional data across European countries uses Nomenclature of Territorial Units for Statistics (NUTS) classifications. Examining Scotland's economic output performance at the more regional geography level of NUTS 2 reveals a varying picture, illustrating how national level figures mask regional variations.
It is worth highlighting the time lag with some of the indicators used. This is not unusual when conducting analysis with internationally comparable datasets. Nevertheless, we have endeavoured to use the most recently available data in all our analysis.
In this context, it is worth mentioning Scotland's North Eastern NUTS 2 region, which appears in the top 25% regions across Europe in a number of indicators. The impact of the declining oil and gas sector on the economy of Scotland's North East is not yet evident in the available internationality comparable data. Future releases of Eurostat data are likely to see a decline in the North Eastern region's performance, though it is still likely to be a high performing region.
The following are some key findings from our analysis:
All Scotland's four NUTS 2 regions were in the top 50% of 276 regions across the European Union for economic output (GDP) per inhabitant. North Eastern Scotland ranked 16th. Scotland's GDP per inhabitant performance has declined over the 10-year period to 2015, relative to the European average in all but the North Eastern region of Scotland.
For disposable income per inhabitant North Eastern Scotland ranked in the top quartile at 52nd of 276 regions across the European Union. Eastern Scotland and the Highlands and Islands ranked in high second quartile. South Western Scotland was in the low third quartile, ranked 150 from 276 regions. Disposable income grew in all Scottish regions over the analysis period.
All Scottish NUTS 2 regions were in the top 50% for employment across the European Union. North Eastern Scotland ranked 10th of 276 across the European Union. Highlands and Islands, Eastern Scotland and South Western Scotland were all ranked in high second quartile for employment performance relative to other regions of the European Union. Scotland has had mixed employment growth performance over the 11-years to 2016. Scotland's regional employment rates are still above the EU average. However, the gap between the EU average and the Scottish rate has declined.
Scotland's NUTS 2 regions vary in terms of high-tech employment. Eastern Scotland and South Western Scotland were just outside the top quartile, with rankings of 72 and 89 respectively from 276 regions. North Eastern Scotland and Highlands and Islands were in the bottom quartile, ranking at 219 and 247 respectively.
Figures for 2015 show that Scotland ranks in the second quartile for productivity. There were wide variations between Scotland's four NUTS 2 regions. North Eastern Scotland was in the top 20 of European regions. The other three regions were close to the EU-28 average.
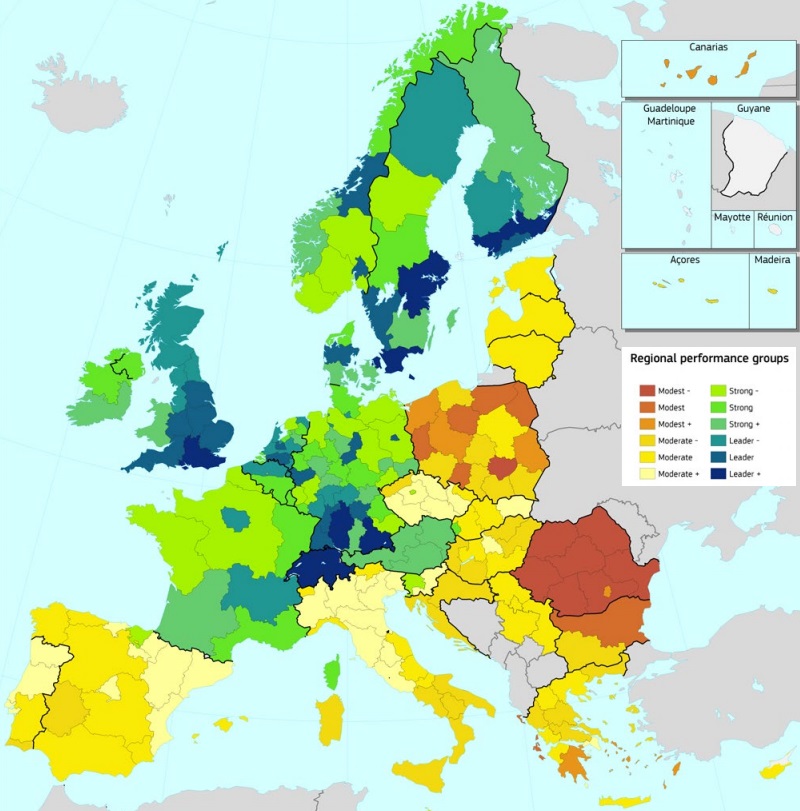
Using a range of indicators, the EU's Regional Innovation Scorecard presents Scotland as a 'Regional Innovation Leader'. Scotland's overall ranking has improved over the past ten years; however, performance within a number of specific indicators - such as exports of high tech goods and working aged population in training - has deteriorated.
Data presented by the Scottish Government in its 2015 Economic Strategy shows that Scotland's income inequality levels are close to the OECD average. Compared to other regions of Europe, Scotland experiences relatively high levels of inequality.
The European Digital City Index shows how well 60 cities across Europe support digital entrepreneurship. From a Scotland perspective, both Edinburgh and Glasgow feature in the Index. Edinburgh ranked 19th and Glasgow 36th, out of 60 European cities for start-up firms. Across both cities, digital infrastructure and access to capital were highlighted as areas for improvement.
About this paper
In October 2017, the Scottish Parliament's Economy, Jobs and Fair Work Committee launched its inquiry into Scotland's economic performance1. One way of assessing how well a country or region is performing is to examine a range of indicators over time. Another is by looking at Scotland's performance compared to other UK and European regions and countries, and this is the approach taken here. This briefing is intended to inform the Committee's evidence sessions during its inquiry; however, given the topic, it is likely to be of interest to most Members of the Parliament.
This paper explores Scotland's economic performance relative to other geographies. To allow comparable international benchmarking the majority of the analysis is based on data from Eurostat2 and OECD 3databases. The indicators used in this analysis were determined by international data availability. They focus on:
economic output per inhabitant
disposable income of private households
employment rates (including high-tech employment)
productivity
innovation
income inequality
entrepreneurship and technology.
Notes for data interpretation
For context, the Scottish Government's National Performance Framework (NPF)1 has been referenced throughout this paper. Many of the indicators explored here - economic growth, productivity, employment rates - are directly relevant to some of the NPF Purpose Targets.
NUTS geography
To allow comparable international benchmarking at a regional level, much of the analysis in this paper is based on NUTS 2 level data from Eurostat. The NUTS (Nomenclature of territorial units for statistics) classification is a hierarchical system for dividing up the economic territory of the EU for the purpose of:
the collection, development and harmonisation of European regional statistics
socio-economic analyses of the regions
framing of EU regional policies.
The NUTS 2013 classification used in this analysis was valid from 1 January 2015 and lists 98 regions at NUTS 1, 276 regions at NUTS 2 and 1,342 regions at NUTS 3 level. Within the NUTS 2013 classification, Scotland has four NUTS 2 regions:
UKM2: Eastern Scotland which contains Angus, Dundee, Clackmannanshire, Fife, East Lothian, Midlothian, Scottish Borders, Edinburgh, Falkirk, Perth and Kinross, Stirling, and West Lothian.
UKM3: South Western Scotland which contains East Dunbartonshire,West Dunbartonshire, and Helensburgh and Lomond; Dumfries and Galloway; East and North Ayrshire mainland; Glasgow: Inverclyde, East Renfrewshire, and Renfrewshire; North Lanarkshire; South Ayrshire; and South Lanarkshire.
UKM5: North Eastern Scotland which contains Aberdeen and Aberdeenshire.
UKM6: Highlands and Islands which contains Caithness and Sutherland, and Ross and Cromarty; Inverness, Nairn, Moray, and Badenoch and Strathspey; Lochaber, Skye and Lochalsh,Arranand Cumbrae, and Argyll and Bute (except Helensburgh and Lomond); Eilean Siar (Western Isles); Orkney Islands; Shetland Islands.
Where NUTS 2 data level is not available, Scotland data is presented alongside other NUTS 1 areas, for example Greater London, West Midlands, Wales, etc., or compared to other European countries.
It should be noted that the configuration of Scotland's NUTS 2 regions will change from 1 January 2018 under Commission Regulation 2016/2066, which provides for a further amendment following territorial reorganisations in several member states.
Quartile rankings
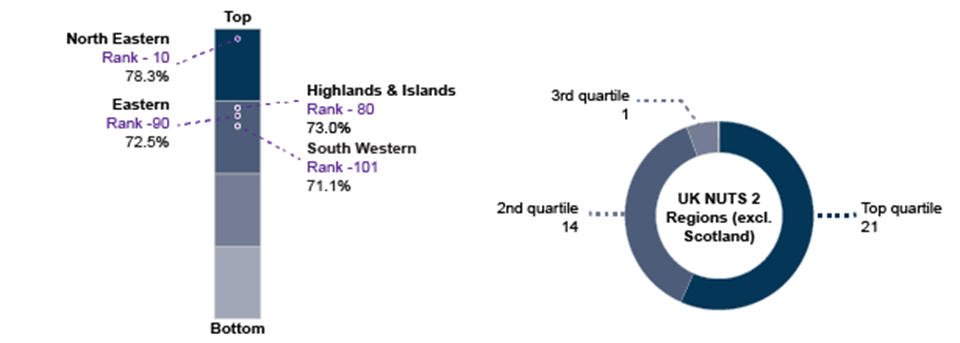
In the areas of this paper where NUTS 2 regional analysis are presented, the following terminology has been used.
Top quartile - the NUTS 2 region in question is within the top 25% of the 276 NUTS 2 regions.
High 2nd quartile - the NUTS 2 region in question is within the 26%-50% (above average) of the 276 NUTS 2 regions.
Low 3rd quartile - the NUTS 2 region in question is within the 51%-75% (below average) of the 276 NUTS 2 regions.
Bottom quartile - the NUTS 2 region in question is within the bottom 25% of the 276 NUTS 2 regions.
The chart below provides an example of the quartile data visualisations of Scottish NUTS 2 regions and rest of UK NUTS 2 regions throughout this report.
Economic growth
This section explores economic output and disposable income performance by European region and the relative position of Scotland.
Economic growth and the National Performance Framework
Scotland Performs1 measures and reports on the progress of government in Scotland, against a wide range of indicators, as set out in the National Performance Framework (NPF)2. Within the NPF there are two purpose targets related to economic growth and Gross Domestic Product (GDP). These are:
to raise the GDP growth rate to the UK level
to match the GDP growth rate of the small independent European Union (EU) countries by 2017.
For the UK target, the latest data3 show as at 2017Q2 annual GDP growth in Scotland was 1.5 percentage points lower than in the UK.
For the small EU countries target, the latest data show as at 2017Q2 annual GDP growth in Scotland was 2.6 percentage points lower than in the Small EU Countries. Between 2017Q1 and 2017Q2 the gap between annual Scottish and Small EU GDP growth rates increased by 0.2 percentage points in favour of small EU.
Examining Scotland's economic output performance at the more regional geography level of NUTS 2 reveals a differing and varying picture relative to comparison with small EU countries alone.
Economic output
GDP per inhabitant in purchasing power standards (PPS) is a key variable for allowing cross country comparison of economic performance.
GDP is an indicator of the output of a country or a region. It reflects the total value of all goods and services produced less the value of goods and services used for intermediate consumption in their production.
Expressing GDP in PPS eliminates differences in price levels between countries. PPS is an artificial currency unit. Theoretically, one PPS can buy the same amount of goods and services in each country. PPS are derived by dividing any economic aggregate of a country in national currency by its respective purchasing power parities.
Calculations on a per inhabitant basis allow for the comparison of economies and regions significantly different in absolute size.
Economic output performance
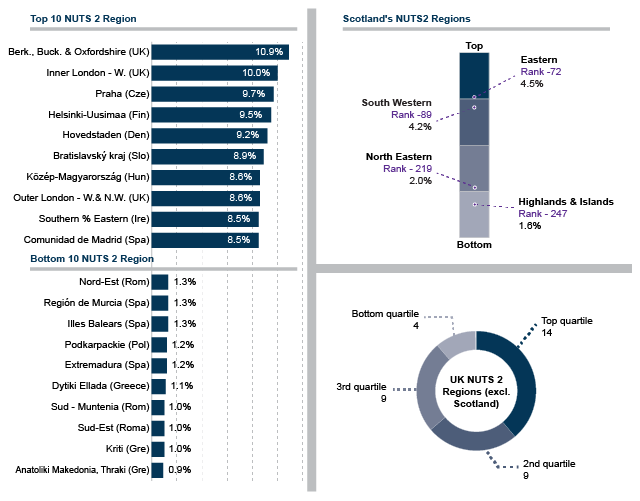
Source: Eurostat. (2017, October 18). Regional Statistics Database. Retrieved from http://ec.europa.eu/eurostat/data/database [accessed 19 October 2017] Note PPS is an artificial currency unit, which is used within the European Union in order to express summary economic indicators, as well as carry out spatial comparisons, by eliminating price differences among member states.
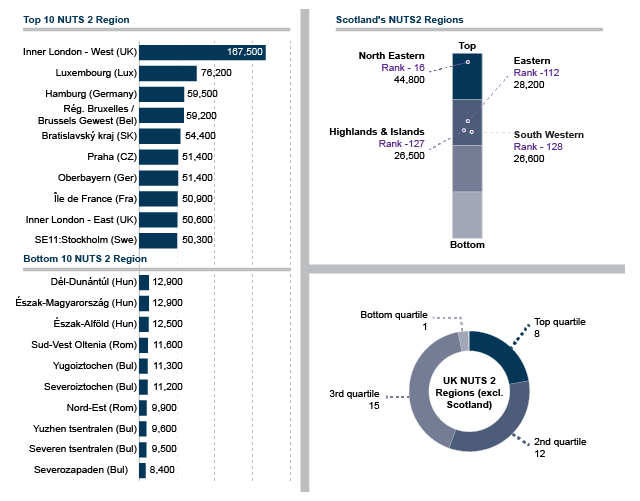
The top 10 performing regions in terms of GDP per inhabitant represented a variety of areas across Europe. Inner London - West was by far the highest performing region, with more than twice the level of GDP per inhabitant than Luxembourg, the next highest region. Regions from both Germany and the UK appeared twice in the top 10. The bottom performing areas were dominated by Bulgaria, Romania, and Hungary.
All Scottish NUTS 2 regions were in the top 50% for GDP per inhabitant. North Eastern Scotland (which encompasses Aberdeen and Aberdeenshire) ranked 16th of 276 across the European Union and was third highest performing NUTS region in the UK after London Inner - West and London Inner - East (in total the UK has 40 NUTS 2 regions). Eastern Scotland, Highlands and Islands, and South Western Scotland were all ranked in high second quartile for economic output performance relative to other regions of the European Union.
Across the remainder of the UK, the largest number of regions fell within the low third quartile (these included northern English regions, Northern Ireland, Devon, Cornwall and Isles of Scilly). West Wales and The Valleys was the only UK region within the bottom quartile, ranked 217. Apart from North Eastern Scotland, all the UK regions in the top quartile were in the south east of England.
Economic output growth
| Top 20 | Absolute change (2005 to 2015) GDP per inhabitant in PPS |
|---|---|
| UKI3:Inner London - West (UK) | 47,100 |
| RO32:Bucuresti - Ilfov (Romania) | 20,200 |
| SK01:Bratislavský kraj (Slovakia) | 20,100 |
| LU00:Luxembourg (Luxembourg) | 18,900 |
| PL12:Mazowieckie (Poland) | 13,400 |
| UKM5:North Eastern Scotland (UK) | 13,300 |
| DE11:Stuttgart (Germany) | 12,300 |
| CZ01:Praha (Czech Republic) | 11,700 |
| DE21:Oberbayern (Germany) | 11,100 |
| DE23:Oberpfalz (Germany) | 11,000 |
| DK01:Hovedstaden (Denmark) | 10,900 |
| FR10:Île de France (France) | 10,800 |
| DE91:Braunschweig (Germany) | 10,600 |
| AT32:Salzburg (Austria) | 10,100 |
| DE14:Tübingen (Germany) | 9,900 |
| PL51:Dolnoslaskie (Poland) | 9,900 |
| SE11:Stockholm (Sweden) | 9,900 |
| DE25:Mittelfranken (Germany) | 9,800 |
| DE22:Niederbayern (Germany) | 9,600 |
| DE24:Oberfranken (Germany) | 9,400 |
Source: Eurostat. (2017, October 18). Regional Statistics Database. Retrieved from http://ec.europa.eu/eurostat/data/database [accessed 19 October 2017] Note PPS is an artificial currency unit, which is used within the European Union in order to express summary economic indicators, as well as carry out spatial comparisons, by eliminating price differences among member states.
Table 1 shows the top-20 NUTS 2 regions, in terms of growth in GDP per inhabitant over a 10 year period. Germany very much dominates the top performing regions, with German regions making up 40% of the table.
The large increases in GDP per inhabitant in the capital regions of both Romania and Slovakia reflect a relatively low 2005 baseline that was accelerated by these regions joining the European Union around the start of the baseline period (Romania in 2007 and Slovakia in 2004).
North Eastern Scotland had the sixth highest growth in GDP per inhabitant across the European Union over the 10-year period 2005 to 2015.
Table 2 shows that Scotland's GDP per inhabitant performance has declined, over the 10-year period to 2015, relative to the European average in all but the North Eastern region of Scotland.
In 2005, three Scottish regions had GDP per inhabitant above the European Union average and South Western Scotland was exactly in line with the average. Ten years later the situation looks quite different, illustrating the regional disparities in Scotland's economic performance.
Both South Western Scotland and the Highlands and Islands have declined to 92% of the European Union average.
Eastern Scotland has decreased to just below the EU average at 98%.
North Eastern Scotland has increased its performance from 134% of EU average in 2005 to 155% in 2015.
| NUTS 2 Region | 2005 | 2015 |
|---|---|---|
| North Eastern Scotland | 134 | 155 |
| Eastern Scotland | 109 | 98 |
| South Western Scotland | 100 | 92 |
| Highlands and Islands | 103 | 92 |
Source: Eurostat. (2017, October 18). Regional Statistics Database. Retrieved from http://ec.europa.eu/eurostat/data/database [accessed 19 October 2017]
Disposable income of private households
Disposable income is defined as the sum of household final consumption expenditure and savings, minus the change in net equity of households in pension funds. This indicator also corresponds to the balance of primary income (operating surplus/mixed income plus compensation of employees plus property income received minus property income paid) and the redistribution of income in cash.
These transactions comprise social contributions paid, social benefits in cash received, current taxes on income and wealth paid, as well as other current transfers.
Disposable income does not include social transfers in kind coming from public administrations or non-profit institutions serving households.
Eurostat data on disposable incomes of private households are presented by purchasing power standards (PPS) (based on final consumption) per inhabitant.
Expressing the data in PPS eliminates differences in price levels between countries. PPS is an artificial currency unit. Theoretically, one PPS can buy the same amount of goods and services in each country. PPS are derived by dividing any economic aggregate of a country in national currency by its respective purchasing power parities.
Calculations on a per inhabitant basis allow for the comparison of economies and regions significantly different in absolute size.
Disposable income performance
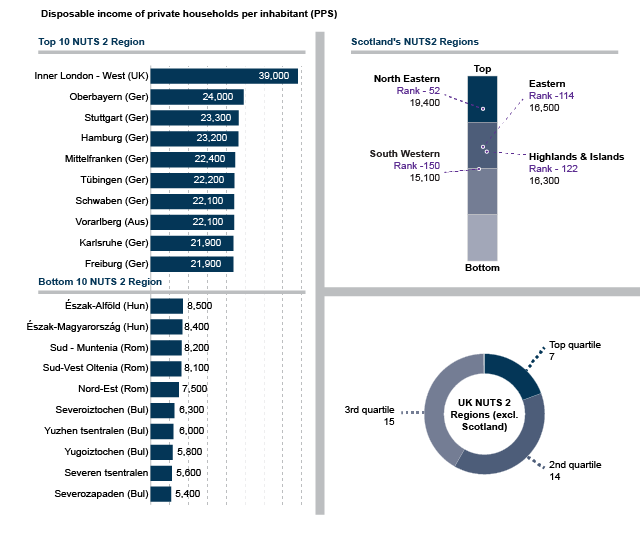
The top-10 performing regions in terms of disposable income per inhabitant were dominated by German regions, with only London and Vorarlberg in Austria also appearing on the list. Inner London-West topped the list The bottom performing areas were dominated by areas in Bulgaria, Romania, and Hungary.
The performance of the Scottish NUTS 2 regions varied in terms of disposable income per inhabitant.
North Eastern Scotland ranked in the top quartile at 52nd of 276 regions across the European Union.
Eastern Scotland and the Highlands and Islands ranked in high second quartile.
South Western Scotland was in the low third quartile ranked 150 from 276 regions.
Across the remainder of the UK, the largest number of regions fell within the low third quartile (these included northern English regions, Northern Ireland, West Wales and The Valleys, Devon, Cornwall and Isles of Scilly). Apart from North Eastern Scotland all the UK regions in the top quartile were in the south east of England.
Source: Eurostat. (2017, October 18). Regional Statistics Database. Retrieved from http://ec.europa.eu/eurostat/data/database [accessed 19 October 2017] Note PPS is an artificial currency unit, which is used within the European Union in order to express summary economic indicators, as well as carry out spatial comparisons, by eliminating price differences among member states.
Disposable income growth
Inner London West tops the list for absolute growth in disposable income over the 10-year period to 2014. Fifteen of the regions with the largest growth in disposable income of private households (PPS) per inhabitant in Table 3 were in eastern Europe, reflecting the low levels of economic performance in these regions in the baseline period.
Regions with mature economies, similar to Scotland, that saw significant growth in disposable income were Stockholm and Västsverige in Sweden, Trier in Germany, and Vorarlberg in Austria.
| Top 20 | Absolute change 2004 to 2014 |
|---|---|
| UKI3:Inner London - West (UK) | 11,200 |
| RO32:Bucuresti - Ilfov (Romania) | 10,000 |
| SK01:Bratislavský kraj (Slovkia) | 7,300 |
| SE11:Stockholm (Sweden) | 6,100 |
| RO42:Vest (Romania) | 6,000 |
| PL12:Mazowieckie (Poland) | 5,500 |
| RO11: Nord-Vest (Romania) | 5,500 |
| RO12:Centru (Romania) | 5,500 |
| BG41:Yugozapaden (Bulgaria) | 5,300 |
| PL22:Slaskie (Poland) | 5,300 |
| RO22: Sud-Est (Romania) | 5,000 |
| DEB2:Trier (Germany) | 4,900 |
| RO31:Sud - Muntenia (Romania) | 4,800 |
| SK03:Stredné Slovensko (Slovakia) | 4,800 |
| SE23:Västsverige (Sweden) | 4,800 |
| LT00:Lietuva (Lithuania) | 4,700 |
| AT34:Vorarlberg (Austria) | 4,700 |
| PL51:Dolnoslaskie (Poland) | 4,700 |
| RO21:Nord-Est (Romania) | 4,700 |
| RO41:Sud-Vest Oltenia (Romania) | 4,700 |
Source: Eurostat. (2017, October 18). Regional Statistics Database. Retrieved from http://ec.europa.eu/eurostat/data/database [accessed 19 October 2017] Note PPS is an artificial currency unit, which is used within the European Union in order to express summary economic indicators, as well as carry out spatial comparisons, by eliminating price differences among member states.
Over the period in question, North Eastern Scotland and Highlands and Islands saw the largest increases in disposable income at 4,400 and 3,900 respectively in absolute terms. Eastern Scotland and South Western Scotland saw more minor increases at 1,900 and 1,700 respectively in absolute terms.
| 2004 | 2014 | Change | |
|---|---|---|---|
| Eastern Scotland | 14,600 | 16,500 | 1,900 |
| South Western Scotland | 13,400 | 15,100 | 1,700 |
| North Eastern Scotland | 15,000 | 19,400 | 4,400 |
| Highlands and Islands | 12,400 | 16,300 | 3,900 |
Source: Eurostat. (2017, October 18). Regional Statistics Database. Retrieved from http://ec.europa.eu/eurostat/data/database [accessed 19 October 2017]
Employment
Employment and the National Performance Framework
The Scottish Government's National Performance Framework (NPF) includes a number of targets and indicators relating to labour market participation. For example, there are two National Purpose Targets tracking Scotland's employment rate relative to the UK's and other OECD countries. These are:
to maintain Scotland's position on labour market participation as the top performing country in the UK
to close the gap with the top five OECD economies by 2017.
The most recent NPF update shows that Scotland is meeting neither target 1. However, examining employment performance by Scottish region shows a more positive picture.
Scotland's employment performance
Compared with other European countries, Scotland ranks 9th out of 34 countries in terms of its 15-64 employment rate (using figures for 2016). The following table shows how employment rates have changed over the past decade, with Scotland's reducing slightly between 2007 and 2016 (although Labour Force Survey data for 2017 shows record employment levels).
| Country | 2007 | 2016 | Change | |
|---|---|---|---|---|
| 1 | Iceland | 85.1 | 86.6 | Increase |
| 2 | Switzerland | 78.6 | 79.6 | Increase |
| 3 | Sweden | 74.2 | 76.2 | Increase |
| 4 | Denmark | 77.0 | 74.9 | Decrease |
| 5 | Netherlands | 76.0 | 74.8 | Decrease |
| 6 | Germany | 69.0 | 74.7 | Increase |
| 7 | Norway | 76.8 | 74.3 | Decrease |
| 8 | United Kingdom | 71.5 | 73.5 | Increase |
| 9 | Scotland | 73.3 | 72.8 | Decrease |
| 10 | Estonia | 69.8 | 72.1 | Increase |
Source: Eurostat. (2017, October 18). Regional Statistics Database. Retrieved from http://ec.europa.eu/eurostat/data/database [accessed 19 October 2017]
Employment performance by NUTS 2 region
The regional (NUTS level 2) employment rates in Figure 3 represent employed persons aged 15-64 as a percentage of the population of the same age group. The indicator is based on the EU Labour Force Survey. The survey covers the entire population living in private households and excludes those in collective households such as boarding houses, halls of residence and hospitals.
Source: Eurostat. (2017, October 18). Regional Statistics Database. Retrieved from http://ec.europa.eu/eurostat/data/database [accessed 19 October 2017]
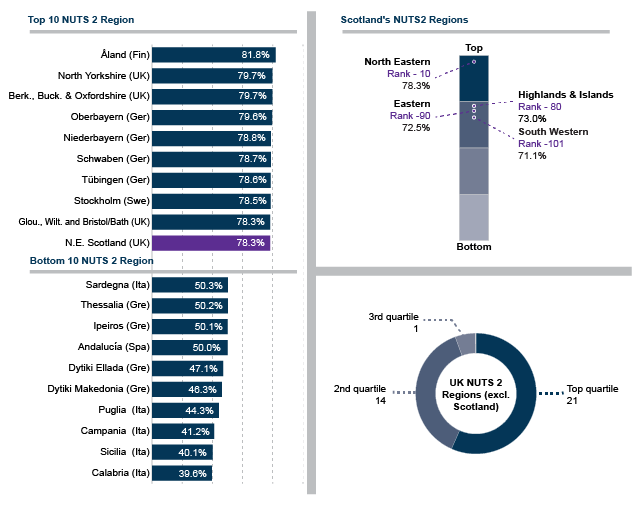
The Åland region in Finland had the highest employment rate in Europe. The Åland region has unique characteristics being an archipelago in the Baltic Sea belonging to Finland. It is autonomous, demilitarised, and is the smallest region in Finland. Both the UK and Germany had four regions in the top-10 for employment rates. The bottom-10 regions for employment were dominated by Italy and Greece, with Spain also appearing.
All Scottish NUTS 2 regions were in the top 50% for employment across the European Union. North Eastern Scotland ranked 10th of 276 across the European Union. Highlands and Islands, Eastern Scotland and South Western Scotland were all ranked in high second quartile for employment performance relative to other regions of the European Union.
Across the remainder of the UK, the largest number of regions fell within the top quartile. The West Midlands was the region with the lowest employment rate in the UK and the only UK region to feature in the low third quartile.
Of note is the contrasts in geographies featured in Figure 3 relative to Table 5, illustrating how national level figures mask regional variations.
Employment growth by NUTS 2 region
| Top 20 | Percentage point change 2005 to 2016 |
|---|---|
| PL51:Dolnoslaskie (Poland) | 16.3 |
| PL63:Pomorskie (Poland) | 14.6 |
| DED2:Dresden (Germany) | 14.4 |
| DE40:Brandenburg (Germany) | 14.1 |
| DED5:Leipzig (Germany) | 14 |
| DEG0:Thüringen (Germany) | 13.4 |
| DEE0:Sachsen-Anhalt (Germany) | 13.3 |
| PL22:Slaskie (Poland) | 13.1 |
| DE30:Berlin (Germany) | 13 |
| PL43:Lubuskie (Poland) | 12.9 |
| DED4:Chemnitz (Germany) | 12.8 |
| PL41:Wielkopolskie (Poland) | 12.6 |
| PL11:Lódzkie (Poland) | 12.5 |
| HU31:Észak-Magyarország (Hungary) | 12.3 |
| PL42:Zachodniopomorskie (Poland) | 12.2 |
| MT00:Malta (Malta) | 12.2 |
| PL52:Opolskie (Poland) | 12.1 |
| HU33:Dél-Alföld (Hungary) | 11.9 |
| DE50:Bremen (Germany) | 11.9 |
| HU32:Észak-Alföld (Hungary) | 11.8 |
Source: Eurostat. (2017, October 18). Regional Statistics Database. Retrieved from http://ec.europa.eu/eurostat/data/database [accessed 19 October 2017]
Table 6 shows that regions in Poland and Germany have seen the most major increases in employment rates at a NUTS 2 level. Every region on the top-20 list experienced employment rate growth greater than 10 percentage points between 2005 and 2016. This rate of growth demonstrates a significant turnaround in economic performance. Over the same period Scotland had a more mixed employment rate performance:
South Western Scotland - 2.4 pp increase
North Eastern Scotland - 1.2 pp increase
Eastern Scotland - 1.1 pp decrease
Highlands and Islands - 2.6 pp decrease
Table 7 shows that Scotland's regional employment rates are still above the EU average. However, the gap between the EU average and the Scottish rate has declined. For example in 2015, the Highland's and Islands employment rate was 19 percentage points above the EU average but in 2016 was just 9 percentage points above the EU average.
| 2005 | 2016 | |
|---|---|---|
| North Eastern Scotland | 121 | 117 |
| Eastern Scotland | 116 | 109 |
| South Western Scotland | 109 | 108 |
| Highlands and Islands | 119 | 109 |
Source:Eurostat. (2017, October 18). Regional Statistics Database. Retrieved from http://ec.europa.eu/eurostat/data/database [accessed 19 October 2017]
High tech employment performance by NUTS 2 region
The data shows employment in high-tech sectors as a percentage of total employment. The data are aggregated according to the sectoral approach at NACE Rev.2 - this is the French abbreviation for the Statistical Classification of Economic Activities in the European Community - which is the equivalent to SIC coding in the UK. The high-tech employment definition includes the following sectors:
Manufacture of basic pharmaceutical products and pharmaceutical preparations; Manufacture of computer, electronic and optical products.
Manufacture of chemicals and chemical products; Manufacture of electrical equipment; Manufacture of machinery and equipment not elsewhere classified; Manufacture of motor vehicles, trailers and semi-trailers; Manufacture of other transport equipment.
The sectors included in the European Commission's high-tech employment definition, reflect what is often referred to as advanced manufacturing in the UK.
Jobs in high-tech sectors tend to contribute relatively higher levels of Gross Value Added (GVA). The regional variations in the intensity of high-tech employment across the UK and ultimately the resulting GVA contribution, very much reflects the regional disparities in economic wealth across the UK.
Source: Eurostat. (2017, October 18). Regional Statistics Database. Retrieved from http://ec.europa.eu/eurostat/data/database [accessed 19 October 2017]
Figure 4 shows clusters of high-tech employment across a variety of European regions. Two regions in the south east of England top the list in terms of employment in high-tech sectors - where approximately one in ten people in these regions work in high-tech sectors.
Notably no German regions feature in the top-10. Although the majority of German regions do feature elsewhere in the top-50 regions.
The Southern and Eastern region in Ireland and the Communidad de Madrid in Spain both feature in the top-10, which are not regions featuring in top performing lists relating to other indicators throughout this paper.
Regions in Greece, Romania, and Spain make up the parts of Europe with the lowest presence of high-tech employment.
Scotland's NUTS 2 regions vary in terms of high-tech employment. Eastern Scotland and South Western are just outside the top quartile, with rankings of 72 and 89 respectively from 276 regions. Whereas North Eastern Scotland and the Highlands and Islands are in the bottom quartile, ranking at 219 and 247 respectively. Given the business base structure of North Eastern Scotland, it might be expected that it would rank higher for high-tech employment. However, it is likely two factors contribute to the lower ranking.
Many of the engineering and manufacturing industry sectors in the North East don't fall within the high-tech sector definition as specified by Eurostat. Instead, the relevant sectors in the North East tend to fall within the definitions of medium-tech and medium-low tech.
A relatively higher proportion of people who work in oil and gas related sectors are classified as self-employed - many with their own companies where they are often the sole employee—for tax related purposes. This results in under-reporting in employment data.
Across the remainder of the UK, there were extreme regional variations in high-tech employment. The largest number of regions fell within the top quartile, with the majority of these clustered around the South East of England. Outside of Scotland, the four UK regions to feature in the bottom quartile for high-tech employment were: West Midlands, West Wales & the Valleys, Cumbria, and Cornwall and Isles of Scilly.
High tech employment growth by NUTS 2 region
| Top 20 Areas with increases | Percentage point change 2008 to 2016 |
|---|---|
| FR43:Franche-Comté (France) | 3.2 |
| SK01:Bratislavský kraj (Slovakia) | 3.2 |
| RO32:Bucuresti - Ilfov (Romania) | 2.4 |
| EE00:Eesti (Estonia) | 2.2 |
| BG41:Yugozapaden (Bulgaria) | 2.1 |
| CZ01:Praha (Czech Republic) | 2.1 |
| RO42:Vest (Romania) | 1.9 |
| CZ07:Strední Morava (Czech Republic) | 1.6 |
| IE02:Southern and Eastern (Ireland) | 1.5 |
| CZ06:Jihovýchod (Czech Republic) | 1.4 |
| ES13:Cantabria (Spain) | 1.4 |
| HU10:Közép-Magyarország (Hungary) | 1.4 |
| HU31:Észak-Magyarország (Hungary) | 1.3 |
| RO12:Centru (Romania) | 1.3 |
| AT12:Niederösterreich (Austria) | 1.2 |
| AT22:Steiermark (Austria) | 1.2 |
| DE23:Oberpfalz (Germany) | 1.2 |
| UKG2:Shropshire and Staffordshire (UK) | 1.1 |
| UKJ2:Surrey, East and West Sussex (UK) | 1.1 |
| EL30:Attiki (Greece) | 1 |
Source: Eurostat. (2017, October 18). Regional Statistics Database. Retrieved from http://ec.europa.eu/eurostat/data/database [accessed 19 October 2017]
The levels of growth in high-tech employment across Europe have been relatively low over the period 2008 to 2016. Regions in France and Slovakia achieved the highest growth rates, yet this was only 3.2 percentage points over the eight years to 2016.
Table 8 shows that quite a few eastern European regions displayed strong growth in high-tech employment, reflecting the low 2008 baseline figures of these regions.
The relatively mature economies demonstrating high-tech employment growth were: Southern and Eastern in Ireland, the Niederösterreich and Steiermark regions of Austria, Oberpfalz in Germany, and Shropshire, Staffordshire, Surrey, East and West Sussex in the UK.
In the 8-year period to 2016, high-tech employment has decreased across all NUTS 2 regions in Scotland. The Highlands and Islands region saw the largest decrease from 2.4% to 1.6% high-tech employment.
| 2008 | 2016 | Change | |
|---|---|---|---|
| Eastern Scotland | 4.7 | 4.5 | Decrease |
| South Western Scotland | 4.3 | 4.2 | Decrease |
| North Eastern Scotland | 2.4 | 2 | Decrease |
| Highlands and Islands | 2.4 | 1.6 | Decrease |
Source: Eurostat. (2017, October 18). Regional Statistics Database. Retrieved from http://ec.europa.eu/eurostat/data/database [accessed 19 October 2017]
Productivity
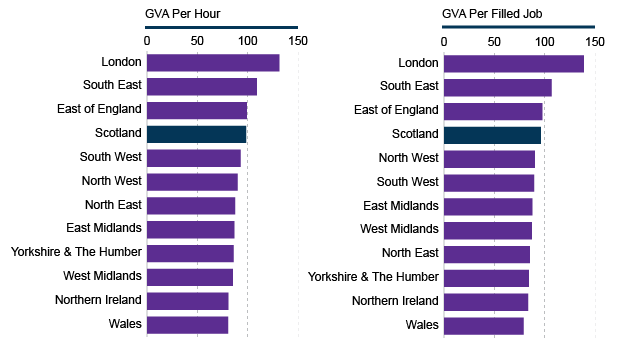
Productivity can be calculated by dividing annual economic output by the total number of hours worked over a year. Gross value added (GVA) per hour worked in Scotland, as presented by the Office for National Statistics, was 98.4% of the UK average in 2015, significantly higher than the rate in either Wales (80.6%) or Northern Ireland (80.9%). Of the nine regions in England, only London (131.5% of the UK average), the South East (109.2%) and the East of England (99.3%) had higher productivity rates than Scotland1.
Looking at relative performance over time, the Fraser of Allander Institute recently concluded that "the gap between Scotland and the UK has closed over the last 15 years or so"2.
Source: ONS. (2017). Regional and sub-regional productivity in the UK. Retrieved from https://www.ons.gov.uk/employmentandlabourmarket/peopleinwork/labourproductivity/articles/regionalandsubregionalproductivityintheuk/jan2017#results-for-england-scotland-wales-and-northern-ireland-by-nuts3-subregions [accessed 10 November 2017]
It is worth bearing in mind that the ONS figure for Scotland does not include North Sea oil and gas activities. The inclusion of extractive activity within the Scottish area of the UKCS would likely increase Scotland's 2015 labour productivity rate above the UK average.
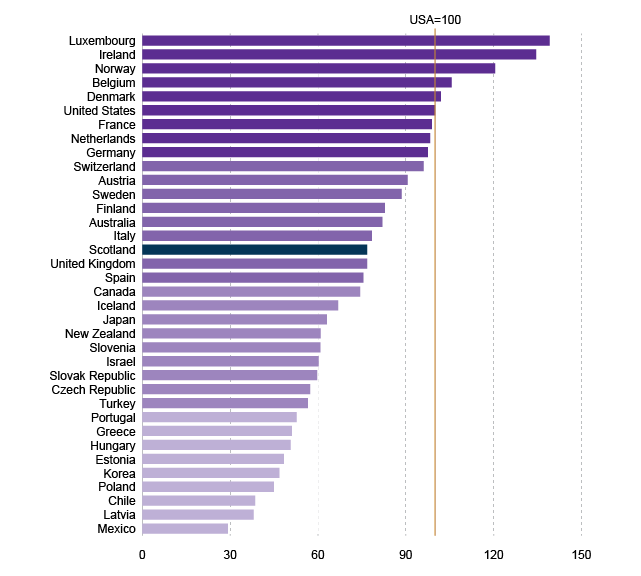
Scottish productivity compared to other OECD countries
According to the Scottish Government, "over the long-term, improvements in productivity performance will increase the competitiveness of an economy and make the largest contribution to increases in overall economic growth rates"1. Therefore, the Scottish Government has a National Purpose Target for Scotland "to rank in the top quartile for productivity against our key trading partners in the OECD by 2017"2. The most recent comparable data available, for 2015, shows Scotland moving into the second quartile of this ranking:
Source: Scottish Government. (2017). National Purpose Target - Productivity. Retrieved from http://www.gov.scot/About/Performance/scotPerforms/purposetargets/productivity
This represents an improvement in relative performance since the NPF was launched in 2007, when Scotland was in the third quartile of ranked countries.
Scottish regional productivity and EU regional performance
There is some variation in productivity performance between Scotland's four NUTS 2 areas. For example, North Eastern Scotland is one of Europe's top 20 regions for productivity (ranked 19th out of 266 regions/countries), whilst the Highlands and Islands region sits just below the EU average (ranked 147th). Scotland's other NUTS 2 areas - Eastern Scotland and South Western Scotland - saw productivity levels just above the EU average in 2014.
The following table shows that the highest labour productivity ratio among European NUTS 2 regions was recorded in Inner London West (which includes the City of London). Value added per hour worked here was more than five times the EU-28 average and also considerably higher than any other region of the Europe1.
| Rank | Region name | Value (EU average =100) |
|---|---|---|
| 1 | Inner London - West | 528.4 |
| 2 | Norway | 254.0 |
| 3 | Luxembourg | 216.4 |
| 4 | Groningen (Netherlands) | 202.5 |
| 5 | Île de France (Parisian region) | 200.2 |
| 6 | Switzerland | 196.0 |
| 7 | Hovedstaden (Denmark) | 190.2 |
| 8 | Stockholm | 188.6 |
| 9 | Southern and East Ireland | 171.3 |
| 10 | Hamburg | 167.7 |
| 19 | North Eastern Scotland | 150.5 |
| 130 | Eastern Scotland | 104.6 |
| 131 | South Western Scotland | 104.3 |
| 147 | Highlands and Islands | 98.0 |
Source: Eurostat. (n.d.) GDP at regional level. Retrieved from http://ec.europa.eu/eurostat/statistics-explained/index.php/GDP_at_regional_level#Labour_productivity [accessed 5 December 2017]
Luxembourg, Groningen (in the Netherlands) and Île de France (the Paris capital city region) follow Inner London, with labour productivity ratios that were just over twice as high as the EU-28 average. There were 17 regions in the EU where labour productivity was at least 50 % higher than the EU-28 average . Regional data for Norway and Switzerland are not available; however both countries clearly rank very highly in terms of value added per hour worked.
Innovation
Innovation is one of the Scottish Government's "4 Is", as highlighted in its 2015 Economic Strategy1 (alongside "investment", "inclusive growth" and "internationalisation"). Innovation refers not just to the development of new products and services, but also encompasses improved production processes, workforce design and business models. It is considered by most economists and policymakers to be a key driver of competitiveness and an important contributor to long term economic growth.
Encouraging higher levels of innovation in the economy has been an aim of every Scottish administration since devolution. Indeed, as far back as 2001, the then Scottish Executive's strategy document A Smart Successful Scotland spoke of the importance of innovation and commercialisation of new technologies as ways to boost productivity2.
UK Innovation Survey
The results of the UK Innovation Survey 2015 show that 50.4 per cent of enterprises in Scotland are "innovation active"1. This means enterprises engaged in any of the following activities:
1. Introduction of a new or significantly improved product (good or service) or process.
2. Engagement in innovation projects not yet complete or abandoned.
3. New or significantly improved forms of organisation, business structures or practices and marketing concepts or strategies.
4. Activities in areas such as internal research and development, training, acquisition of external knowledge or machinery and equipment linked to innovation activities.
The following map shows Scotland's innovation performance compared to other NUTS 1 regions of the UK. The percentage of innovation active enterprises in Scotland, 50.4%, is 2.6 percentage points lower than the UK average of 53.0%. Of all the regions of the UK, Yorkshire and the Humber has the highest proportion of innovation active enterprises. The South West of England, Wales and London have the lowest rates.
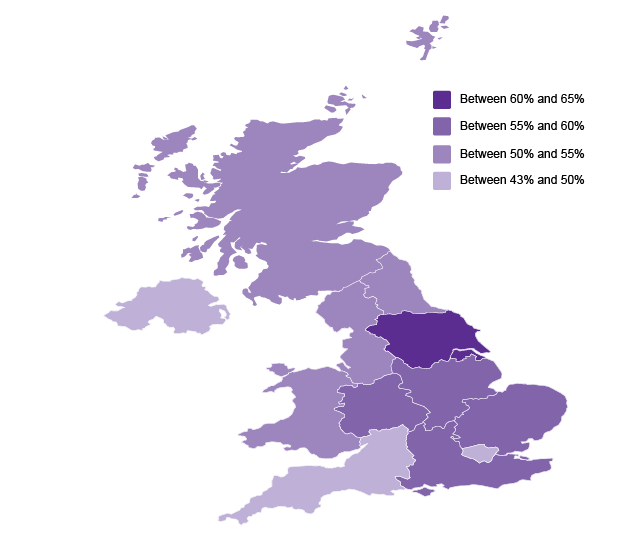
Source: Scottish Government. (2016). UK Innovation Survey - Results for Scotland. Retrieved from http://www.gov.scot/Topics/Statistics/Browse/Business/Publications/UKIS/UKIS-Scotland
The Regional Innovation Scorecard
The European Commission, like the Scottish Government, stresses the importance of innovation to regional economies: “there is a strong and positive link between regional innovation performance and regional competitiveness”1.
The Commission publishes a Regional Innovation Scoreboard (RIS) which assesses the innovation performance of European regions using a number of measurements. Recognising there are many productivity enhancing factors within an economy, the RIS uses a broad range of indicators, including:
SMEs with product or process innovations.
SMEs with marketing or organisational innovations.
Innovative SMEs collaborating with others.
Proportion of the 30-34 year old population with tertiary education.
Research and development (R&D) expenditure by the business sector.
R&D spend by the public sector.
Various higher education and university research activities.
Patent and trademark applications.
Estimated exports of high tech manufactured goods.
Employment in high tech manufacturing and knowledge-intensive services.
The RIS totals the various individual indicators and presents an overall score in a tabular format, making it easy to compare performance over time and to rank the different regions.
The RIS 2017 covers 220 regions across 22 EU countries, and three non-EU countries Norway, Serbia, and Switzerland. Cyprus, Estonia, Latvia, Lithuania, Luxembourg, and Malta are included at country level. The regions included in the Scoreboard broadly correspond to EU NUTS 1 area classifications, so Scotland is presented as a single region and England is split into its 9 regions.
Europe's most innovative regions and Scotland's relative performance
Scotland is ranked 41st out of 220 regions, within the top quartile of the RIS rankings. As such, the Commission categorises us as a ‘Regional Innovation Leader’.
Scotland is less innovative than most regions of England – including London, the South East, the South West, the East of England and the two Midlands regions. Scotland is, however, performing better than Northern Ireland, Wales and the North West of England. Furthermore, there has been a significant improvement in relative performance since 2009 when Scotland ranked 63rd.
The 2017 Scoreboard confirms that the most innovative regions in Europe are in Switzerland, with Zurich and Nordwestschweiz being the first and second most innovative regions.
It also shows that Stockholm in Sweden, Hovedstaden (Copenhagen) and England’s South East are the most innovative regions within the European Union area.
| Rank | Region | Country | RSI score (100=EH average in 2011) |
|---|---|---|---|
| 1 | Zürich | Switzerland | 183.0 |
| 2 | Nordwestschweiz | Switzerland | 170.8 |
| 3 | Stockholm | Sweden | 169.4 |
| 4 | Zentralschweiz | Switzerland | 159.1 |
| 5 | Hovedstaden | Denmark | 159.0 |
| 6 | Ticino | Switzerland | 156.5 |
| 7 | Ostschweiz | Switzerland | 153.6 |
| 8 | South East (of England) | United Kingdom | 152.1 |
| 9 | Région lémanique | Switzerland | 151.7 |
| 10 | Östra Mellansverige | Sweden | 150.1 |
Source: European Commission. (2017, undefined). Regional Innovation Scorecard. Retrieved from http://ec.europa.eu/growth/industry/innovation/facts-figures/regional_en [accessed 30 October 2017]
Of these top 10 performing areas, the region seeing the most significant improvement since 2009 is the South East of England.
UK regions overall are well represented in the top quarter of innovating regions, with eight of the top 45 regions being in the UK. Particularly striking is the number of English regions seeing significant improvements in relative performance since 2009, with Yorkshire and Humber rising an impressive 59 places in the rankings over the period.
Source: European Commission. (2017, undefined). Regional Innovation Scorecard. Retrieved from http://ec.europa.eu/growth/industry/innovation/facts-figures/regional_en [accessed 30 October 2017]
Reasons for Scotland's improved ranking
As stated above, Scotland's ranking improved markedly between the the 2009 and the 2017 RIS publications, moving from 63rd to 41st. From data requested from the Commission, it is possible to drill down to the various individual indicators to understand what has driven this improvement. For example, Scotland has seen significant improvements in the four indicators highlighted in Table 12.
| Innovative SMEs collaborating with others |  |
| Population aged 30-34 with completed tertiary education |  |
| Number of scientific academic publications with at least one co-author based in Scotland | |
| Sales of new-to-market and new-to-firm innovations in SMEs | |
However, over the same period, Scotland saw a weakening of performance in the areas in Table 13.
| Exports of medium-high/high technology-intensive manufacturing |  |
| SMEs innovating in-house | |
| People aged 25 to 64 engaged in education or training | |
| Non-R&D innovation expenditures | |
For an explanation of these indicators, including definitions, sources and the time periods covered, see pages 6 to 12 of the RIS Methodology Report 1.
Income inequality
As well as striving for improved competitiveness and productivity, the Scottish Government's 2015 Economic Strategy includes an aspiration to tackle various inequalities, including income inequality. At the core of the Strategy is the Government's belief that promoting GDP growth and tackling inequality should be "mutually supportive" policy aspirations1.
By income inequality, the Economic Strategy means the distribution of income between households, which can be measured by the Gini coefficient method 1. Wealth inequality is also discussed in the Strategy, with the Government concludes that "in Scotland, as in almost all advanced economies, the distribution of household wealth is even more unequal than the distribution of income".
Comparing Scotland's income inequality with the UK's as a whole, and with other OECD countries, the Government demonstrates:
"Of the 34 OECD countries, the UK ranked 29th in terms of income inequality – in other words, the 6th worst... Whilst income inequality in Scotland is closer to the OECD average than the UK, Scotland is still more unequal than many other countries and would rank 20th".
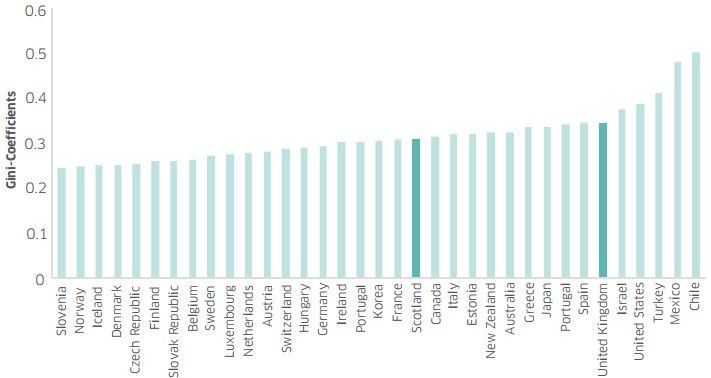
Source: Scottish Government. (2015, March 3). Scotland's Economic Strategy. Retrieved from http://www.gov.scot/Publications/2015/03/5984 [accessed 4 July 2017]
From the above graph, it is seemingly unusual for a developed country of Scotland's relatively small size (5.3 million population) to have such high levels of inequality. Most of the smaller countries in the OECD are among the least unequal in the developed world, with Norway, Denmark, Sweden, and, to a lesser extent, Ireland, all experiencing significantly lower levels of income inequality than Scotland.
The Gini Coefficient
The Gini Coefficient method is a widely used and generally accepted measure of income inequality. It attempts to illustrate how income is distributed across all households in an economy. The measurement ranges from 0 to 1, with 0 indicating perfect equality, i.e every household has the same income, and 1 representing absolute inequality where one household has all income. Obviously, the higher the Gini value the greater the level of income inequality.
It is useful to look at inequality levels both before and after tax and welfare redistributions, as this firstly gives an indication of wage distribution inequality at the market level, and then shows how effective governments are in ameliorating inequalities through their tax and spend decisions.
For example, we know that the Gini Coefficient for the UK before tax and transfers was 0.49 in 2015/16. However, after tax and transfers are accounted for this reduces to 0.351. Writing for the David Hume Institute, Professors David Bell and David Eiser summarise:
"Inequality in the UK is high largely because market income inequality is high, not because the tax and transfer system is not very redistributive; but... this does not mean that there is no scope to achieve further redistribution through taxes and transfers in the UK." 2
Scotland's income inequality compared to other European regions
Using OECD regional statistics from 2013 (the most recent year available at the regional level) we can see how Scotland's income inequality compares to the other 160 regions of the 25 European countries that are also members of the OECD (see full list on the OECD website1).
Before taxes and transfers - Of these 161 regions, Scotland ranks 135th, with the most equal region, Eastern Switzerland, being ranked 1st. Corsica, the most unequal region, is ranked 161st.
After taxes and transfers - taxation and welfare spending improves Scotland's rankings slightly, moving us from 135th to 121st. Once tax redistributions and transfers are applied, the most equal regions of the 161 regions are both in Norway. The most unequal in Europe are Greater London and Sicily.
| Most equal: | Rank | Region | Gini value |
|---|---|---|---|
| 1 | Eastern Switzerland | 0.37 | |
| 2 | Western Norway | 0.39 | |
| 3 | Central Switzerland | 0.39 | |
| 4 | Northern Norway | 0.40 | |
| 5 | Trøndelag (Norway) | 0.40 | |
| 6 | Espace Mittelland (Swiss) | 0.40 | |
| 7 | Province of Bolzano-Bozen (Italy) | 0.41 | |
| 8 | Agder and Rogaland (Norway) | 0.41 | |
| 9 | Central Norrland (Sweden) | 0.41 | |
| 10 | Northwestern Switzerland | 0.41 | |
| 135 | Scotland | 0.53 | |
| Most unequal: | 152 | Campania (Italy) | 0.55 |
| 153 | Athens (Greece) | 0.56 | |
| 154 | Southern and Eastern (Ireland) | 0.57 | |
| 155 | Sicily | 0.57 | |
| 156 | Vienna | 0.57 | |
| 157 | Central Greece | 0.57 | |
| 158 | Border, Midland and Western (Ireland) | 0.58 | |
| 159 | Greater London | 0.58 | |
| 160 | Brussels Capital Region | 0.59 | |
| 161 | Corsica | 0.61 |
Source: OECD. (2017). OECD Stat. Retrieved from http://stats.oecd.org/ [accessed 6 December 2017]
| Most equal: | Rank | Gini value | |
|---|---|---|---|
| 1 | Northern Norway | 0.23 | |
| 2 | Hedmark and Oppland (Norway) | 0.23 | |
| 3 | Burgenland (Austria) | 0.23 | |
| 4 | Central Norrland (Sweden) | 0.23 | |
| 5 | Zealand (Denmark) | 0.23 | |
| 6 | Northern Jutland (Denmark) | 0.24 | |
| 7 | Saxony (Germany) | 0.24 | |
| 8 | Northeast (Czech Republic) | 0.24 | |
| 9 | Southern Denmark | 0.24 | |
| 10 | Southwest (Czech Republic) | 0.24 | |
| 121 | Scotland | 0.31 | |
| Most unequal: | 152 | Corsica | 0.35 |
| 153 | Lazio (Italy) | 0.35 | |
| 154 | Campania (Italy) | 0.35 | |
| 155 | Athens | 0.36 | |
| 156 | Brussels Capital Region | 0.36 | |
| 157 | Estonia | 0.36 | |
| 158 | Sicily | 0.37 | |
| 159 | Melilla (Spain) | 0.38 | |
| 160 | Greater London | 0.39 | |
| 161 | Ceuta (Spain) | 0.41 |
Source: OECD. (2017). OECD Stat. Retrieved from http://stats.oecd.org/ [accessed 6 December 2017]
As is to be expected, all regions become less unequal after the application of tax and welfare polices. However, some regions see more dramatic changes in gini value than others.
For example, both the Irish NUTS 2 regions are among the most unequal regions of all OECD European countries using the pre-tax/distribution measure. However, Ireland's tax and redistribution policies do appear to mitigate this considerably, with the country's Border, Midland and Western region moving from the bottom of the inequality rankings (158th) to the middle (81st).
Pre-tax inequality shows Scotland ranked 135th of the 161 regions (with 1 being the least unequal). However, after tax and welfare interventions Scotland's ranking improves to 121st.
Entrepreneurship and technology
Entrepreneurship and technology (particularly digital) are important drivers of economic performance. The European Digital City Index1 shows how well 60 cities across Europe support digital entrepreneurship. Both Edinburgh and Glasgow feature in the Index. It was produced by the innovation foundation Nesta as part of the European Digital Forum, which exists to support entrepreneurship and digital start-ups across Europe.
For policy makers aiming to encourage entrepreneurship the Index helps to identify existing and promising hubs of activity, in order to learn from their practices. Additionally, it allows benchmarking of performance against other European hubs, and helps identify which policy areas to prioritise.
The Index is comprised of a number of composite indicators, clustered into ten 'themes'. These themes summarise the environment of a given city, as it relates to entrepreneurship and technology. The themes are: Access to Capital, Entrepreneurial Culture, Mentoring and Managerial Assistance, Skills, Business Environment, Digital Infrastructure, Knowledge Spillovers, Market, Lifestyle, and Non-digital Infrastructure.
Start-up perspective
The top-5 cities for start-ups in the context of entrepreneurship and technology were London, Stockholm, Amsterdam, Helsinki, and Paris.
Edinburgh ranked 19th out of 60 European cities for start-up firms.
Edinburgh scored highly on lifestyle (relates to standard of living and cultural and recreation facilities), market (relates to market size, growth in demand, size of potential mobile based market), and entrepreneurial culture (perceptions of entrepreneurship, business density, willingness to take risk, multicultural diversity).
The two areas where Edinburgh ranked in the lower half of the scores were access to capital (access to early-stage funding, access to business angel funding, access to crowdfunding) and digital infrastructure (internet speeds, mobile coverage, cost of broadband, availability of fibre internet).
Glasgow ranked 36th out of 60 European cities for start-up firms.
Glasgow scored highly for market (relates to market size, growth in demand, size of potential mobile based market) and business environment (cost of office space, ease of doing business).
Areas where Glasgow ranked in the bottom half of the scores were non-digital infrastructure (airport connectivity, train connectivity, commuting times), mentoring & managerial assistance (access to accelerators, networking and mentoring events, availability of early stage assistance) , digital infrastructure (internet speeds, mobile coverage, cost of broadband, availability of fibre internet), access to capital (access to early-stage funding, access to business angel funding, access to crowdfunding), and knowledge spillovers (R&D intensity, quality of research institutions).
| Rank (1=best, 60=low) | Edinburgh rankings | Glasgow rankings |
|---|---|---|
| Access to Capital | 34 | 39 |
| Business Environment | 17 | 9 |
| Digital Infrastructure | 37 | 41 |
| Entrepreneurial Culture | 5 | 19 |
| Knowledge Spillovers | 26 | 34 |
| Lifestyle | 2 | 21 |
| Market | 4 | 6 |
| Mentoring & Managerial Assistance | 25 | 46 |
| Non-digital Infrastructure | 25 | 54 |
| Skills | 10 | 17 |
| Overall ranking for start-ups | 19 | 36 |
Source: Nesta (as part of the European Digital Forum). (2016, November 18). European Digital City Index (EDCi). Retrieved from https://digitalcityindex.eu/ [accessed 10 November 2017]
The majority of other UK cities on the Index ranked above Edinburgh and Glasgow. These were London, Cambridge, Bristol, Oxford, and Manchester. Birmingham was ranked 23rd below Edinburgh, and Cardiff was ranked 40th (the lowest ranking UK city).
Scale-up perspective
The top-5 cities for scale-ups were London, Stockholm, Paris, Helsinki, and Amsterdam.
Edinburgh ranked 22nd out of 60 European cities for scale-up firms. Edinburgh scored highly on lifestyle, market, and entrepreneurial culture. The two areas where Edinburgh ranked in the lower half of the scores were access to capital and digital infrastructure.
Glasgow ranked 34th out of 60 European cities for scale-up firms. Glasgow scored highly for market and business environment. Areas where Glasgow ranked in the bottom half of the scores were non-digital infrastructure, mentoring & managerial assistance, digital infrastructure, access to capital, and knowledge spillovers.
| Rank (1=best, 60=low) | Edinburgh rankings | Glasgow rankings |
|---|---|---|
| Access to Capital | 34 | 38 |
| Business Environment | 17 | 9 |
| Digital Infrastructure | 37 | 41 |
| Entrepreneurial Culture | 7 | 21 |
| Knowledge Spillovers | 28 | 39 |
| Lifestyle | 2 | 21 |
| Market | 5 | 6 |
| Mentoring & Managerial Assistance | 25 | 49 |
| Non-digital Infrastructure | 30 | 46 |
| Skills | 14 | 25 |
| Overall ranking for scale-ups | 22 | 34 |
Source:Nesta (as part of the European Digital Forum). (2016, November 18). European Digital City Index (EDCi). Retrieved from https://digitalcityindex.eu/ [accessed 10 November 2017]
Similar to the start-up environment, the majority of other UK cities on the Index ranked above Edinburgh and Glasgow for scale-ups. These were London, Cambridge, Oxford, Bristol, and Manchester. Birmingham was ranked 23rd, and Cardiff was ranked 37th (the lowest ranking UK city).
Summing-up Scotland's comparative economic performance
Table 18 brings together a summary of the indicator analysis in the preceding sections of this paper. The ratings used for Scotland's overall performance summary in Table 18 are:
High: the majority of regions in the top quartile for rankings and growth (rankings weight higher than growth in the overall performance summary)
Medium-high: the majority of regions are above average (high second quartile) for rankings and growth (rankings weight higher than growth in the overall performance summary)
Medium- low: the majority of regions are just below average (low third quartile) for rankings and growth (rankings weight higher than growth in the overall performance summary)
Low: the majority of regions in bottom quartile for rankings and growth (rankings weight higher than growth in the overall performance summary).
The regions identified for high performance and learning are those regions with mature economies similar to Scotland. While many eastern European economies featured in rankings throughout this paper, these have not been highlighted for learning as they are at different maturity levels to the Scottish economy, having been transition economies.
| Indicator | Scotland - key points | Scotland's overall performance summary | High performing regions for benchmarking/ learning |
|---|---|---|---|
| Economic output (GDP) per inhabitant | All Scottish NUTS 2 regions were in top 50% of 276 regions across the EU. North Eastern Scotland ranked 16th. GDP per inhabitant performance has declined, over the 10-year period to 2015, relative to the European average in all but the North Eastern region of Scotland. | Medium-high |
|
| Disposable income of private households per inhabitant | North Eastern Scotland ranked in the top quartile at 52nd of 276 regions. Eastern Scotland and the Highlands and Islands ranked in high second quartile. South Western Scotland ranked lowest at 150. Disposable income grew in all regions over the analysis period. | Medium-high |
|
| Employment rate (15-64 year olds) | All Scottish NUTS 2 regions were in the top 50% for employment. North Eastern Scotland ranked 10th of 276 across the European Union. Highlands and Islands, Eastern Scotland and South Western Scotland were ranked in high second quartile. Scotland's regional employment rates are still above the EU average. But the gap between the EU average and the Scottish rate has declined. | Medium-high |
|
| High-tech employment rate (15-64 year olds) | Scotland performance is very mixed in terms of high-tech employment. Eastern Scotland and South Western are just outside the top quartile, with rankings of 72 and 89 respectively from 276 regions. Whereas North Eastern Scotland and the Highlands and Islands are in the bottom quartile, ranking at 219 and 247 respectively. In the 8-year period to 2016, high-tech employment decreased across all NUTS 2 regions in Scotland. | Low |
|
| Productivity (GDP per hour worked) | Figures for 2015 show that Scotland ranks in the second quartile for productivity "against our key trading partners in the OECD".Wide variations between Scotland's four NUTS 2 regions. North East in the top 20 of European regions. The other three sit close to the EU-28 average. | Medium - high |
|
| Innovation | Using a range of indicators the EU's Regional Innovation Scorecard presents Scotland as a 'Regional Innovation Leader'. Scotland's overall ranking has improved over the past ten years; however, performance within a number of specific indicators - such as exports of high tech goods and working aged population in training - has deteriorated. | High |
|
| Income inequality | Data presented by the Scottish Government in its Economic Strategy shows Scotland's inequality levels to be around the OECD average. Looking at available data for European regions, Scotland is between the highest and the second highest quartiles for inequality. | Medium - low | The least unequal countries in the OECD are: Slovenia; Norway; Iceland; Denmark. The least unequal regions within European members of the OECD are: Northern Norway; Southwest Norway; Eastern Austria; Northern Sweden; Zealand (Denmark). |
| Entrepreneurship & technology | Edinburgh ranked 19th and Glasgow 36th, both out of 60 European cities for start-up firms. Across both cities digital infrastructure and access to capital were highlighted as areas for improvement. | Medium - low |
|
Source: SPICe analysis
This paper's overall verdict based on available comparable data is that Scotland's comparative economic performance is 'Medium - high' relative to European nations and regions. The indicator analysis in this paper's earlier sections illustrates the extent of regional variations within countries, which is often lost in high-level country level figures.
It is worth highlighting the time lag with some of the indicators used. This is not unusual when completing analysis with internationally comparable datasets. We have endeavoured to use the most recently available data in all our analysis. In this context, it is worth mentioning the North Eastern NUTS 2 region, which appears in the top 25% regions across Europe in a number of indicators. The impact of the declining oil and gas sector on the economy of Scotland's North East is not yet evident in the available internationality comparable data. Future releases of Eurostat data are likely to see a decline in the North Eastern regions performance, though it is still likely to be a high performing region.
Sources
Scottish Parliament's Economy, Jobs and Fair Work Committee. (2017, November 17). Inquiry into Scotland's economic performance. Retrieved from <a href="http://www.parliament.scot/parliamentarybusiness/CurrentCommittees/106147.aspx" target="_blank">http://www.parliament.scot/parliamentarybusiness/CurrentCommittees/106147.aspx</a> [accessed 6 December 2017]
Eurostat. (2017, October 18). Regional Statistics Database. Retrieved from <a href="http://ec.europa.eu/eurostat/data/database" target="_blank">http://ec.europa.eu/eurostat/data/database</a> [accessed 19 October 2017]
OECD. (2017). OECD Stat. Retrieved from <a href="http://stats.oecd.org/" target="_blank">http://stats.oecd.org/</a> [accessed 6 December 2017]
Scottish Govenment. (2007). National Performance Framework (NPF). Retrieved from <a href="http://www.gov.scot/About/Performance/scotPerforms/NPFChanges" target="_blank">http://www.gov.scot/About/Performance/scotPerforms/NPFChanges</a> [accessed 25 October 2017]
Scottish Government. (2007). Scotland Performs. Retrieved from <a href="http://www.gov.scot/About/Performance/scotPerforms" target="_blank">http://www.gov.scot/About/Performance/scotPerforms</a> [accessed 20 October 2017]
Scottish Government. (2007). Purpose Targets Scotland Perfroms. Retrieved from <a href="http://www.gov.scot/About/Performance/scotPerforms/purposetargets" target="_blank">http://www.gov.scot/About/Performance/scotPerforms/purposetargets</a> [accessed 25 October 2017]
Scottish Government. (n.d.) National Performance Framework - Participation. Retrieved from <a href="http://www.gov.scot/About/Performance/scotPerforms/purposetargets/participation" target="_blank">http://www.gov.scot/About/Performance/scotPerforms/purposetargets/participation</a> [accessed 2017]
ONS. (2017). Regional and sub-regional productivity in the UK. Retrieved from <a href="https://www.ons.gov.uk/employmentandlabourmarket/peopleinwork/labourproductivity/articles/regionalandsubregionalproductivityintheuk/jan2017#results-for-england-scotland-wales-and-northern-ireland-by-nuts3-subregions" target="_blank">https://www.ons.gov.uk/employmentandlabourmarket/peopleinwork/labourproductivity/articles/regionalandsubregionalproductivityintheuk/jan2017#results-for-england-scotland-wales-and-northern-ireland-by-nuts3-subregions</a> [accessed 10 November 2017]
Fraser of Allander Institute. (2017). Scotland’s recent productivity performance – is it all good news?. Retrieved from <a href="https://fraserofallander.org/2017/03/03/scotlands-recent-productivity-performance-is-it-all-good-news/" target="_blank">https://fraserofallander.org/2017/03/03/scotlands-recent-productivity-performance-is-it-all-good-news/</a> [accessed 10 November 2017]
Scottish Government. (2015, March 3). Scotland's Economic Strategy. Retrieved from <a href="http://www.gov.scot/Publications/2015/03/5984" target="_blank">http://www.gov.scot/Publications/2015/03/5984</a> [accessed 4 July 2017]
Scottish Government. (2017). National Purpose Target - Productivity. Retrieved from <a href="http://www.gov.scot/About/Performance/scotPerforms/purposetargets/productivity" target="_blank">http://www.gov.scot/About/Performance/scotPerforms/purposetargets/productivity</a>
European Commission. (2017). Eurostat Regional Yearbook. Retrieved from <a href="http://ec.europa.eu/eurostat/en/web/products-statistical-books/-/KS-HA-17-001" target="_blank">http://ec.europa.eu/eurostat/en/web/products-statistical-books/-/KS-HA-17-001</a> [accessed 13 November 2017]
Eurostat. (n.d.) GDP at regional level. Retrieved from <a href="http://ec.europa.eu/eurostat/statistics-explained/index.php/GDP_at_regional_level#Labour_productivity" target="_blank">http://ec.europa.eu/eurostat/statistics-explained/index.php/GDP_at_regional_level#Labour_productivity</a> [accessed 5 December 2017]
Scottish Executive. (2001). A Smart Successful Scotland. Retrieved from <a href="http://www.gov.scot/Publications/2001/01/8107/File-1" target="_blank">http://www.gov.scot/Publications/2001/01/8107/File-1</a> [accessed 14 November 2017]
Scottish Government. (2016). UK Innovation Survey - Results for Scotland. Retrieved from <a href="http://www.gov.scot/Topics/Statistics/Browse/Business/Publications/UKIS/UKIS-Scotland" target="_blank">http://www.gov.scot/Topics/Statistics/Browse/Business/Publications/UKIS/UKIS-Scotland</a>
European Commission. (2017, undefined). Regional Innovation Scorecard. Retrieved from <a href="http://ec.europa.eu/growth/industry/innovation/facts-figures/regional_en" target="_blank">http://ec.europa.eu/growth/industry/innovation/facts-figures/regional_en</a> [accessed 30 October 2017]
European Commission. (2017). Regional Innovation Scoreboard 2017 – Methodology report. Retrieved from <a href="http://ec.europa.eu/docsroom/documents/23986" target="_blank">http://ec.europa.eu/docsroom/documents/23986</a> [accessed 6 December 2017]
Office for National Statistics. (2017). Household disposable income and inequality in the UK. Retrieved from <a href="https://www.ons.gov.uk/peoplepopulationandcommunity/personalandhouseholdfinances/incomeandwealth/bulletins/householddisposableincomeandinequality/financialyearending2016" target="_blank">https://www.ons.gov.uk/peoplepopulationandcommunity/personalandhouseholdfinances/incomeandwealth/bulletins/householddisposableincomeandinequality/financialyearending2016</a>
Bell, D., & Eiser, D. (2015). Addressing inequality in Scotland: what can be done?. Retrieved from <a href="https://static1.squarespace.com/static/59b82ed532601e01a494df34/t/59da05ada9db09b4b04cfc9b/1507460534237/Inequality-in-Scotland.pdf" target="_blank">https://static1.squarespace.com/static/59b82ed532601e01a494df34/t/59da05ada9db09b4b04cfc9b/1507460534237/Inequality-in-Scotland.pdf</a>
OECD. (n.d.) List of OECD members countries. Retrieved from <a href="http://www.oecd.org/about/membersandpartners/list-oecd-member-countries.htm" target="_blank">http://www.oecd.org/about/membersandpartners/list-oecd-member-countries.htm</a>
Nesta (as part of the European Digital Forum). (2016, November 18). European Digital City Index (EDCi). Retrieved from <a href="https://digitalcityindex.eu/" target="_blank">https://digitalcityindex.eu/</a> [accessed 10 November 2017]