Income Tax in Scotland: 2017 update
This briefing provides information on income tax in Scotland, including legislation, recent policy developments, and facts and figures on Scottish taxpayer numbers, their incomes and income tax liabilities. It also discusses behavioural responses and includes modelling of illustrative changes to income tax in 2018-19.
Executive Summary
Income tax powers
The Scotland Act 2016 introduced new income tax powers for the Scottish Government. These came into effect from 6 April 2017. The new powers allow the Scottish Government to set rates and bands for non-savings, non-dividend (NSND) income tax. However, the definition of taxable income, the level of allowances (including the personal allowance) and the setting of reliefs remain reserved to the UK Government.
| Personal allowance (£) | Higher rate threshold(£) | Additional rate threshold(£) | Basic rate(%) | Higher rate(%) | Additional rate(%) | |
|---|---|---|---|---|---|---|
| Scotland | 11,500 | 43,000 | 150,000 | 20 | 40 | 45 |
| rUK | 11,500 | 45,000 | 150,000 | 20 | 40 | 45 |
In 2017-18, the Scottish Government opted to leave the higher rate threshold unchanged at £43,000 while the UK Government increased its higher rate threshold to £45,000. All other rates and thresholds remained in line with the rUK. This means that higher and additional rate NSND taxpayers in Scotland will pay up to £400 more than their counterparts in rUK.
In the November 2017 UK Budget, the Chancellor announced a personal allowance of £11,850 for 2018-19. This will also apply in Scotland. The rUK higher rate threshold is to be set at £46,350. Rates and thresholds for Scotland will be announced on 14 December 2017 when the Scottish Government presents its 2018-19 Draft Budget.
The interaction of the UK and Scottish tax systems creates some anomalies. For example, as national insurance contributions (NICs) are linked to UK Government tax thresholds, those earning between £43,000 and £45,000 in Scotland pay tax of 52%. This is because they are subject to both the 40% higher rate of tax and the 12% NIC rate (which falls to only 2% above £45,000).
Block grant adjustment
In 2017-18, the Scottish Government's block grant was adjusted downwards to reflect the devolution of income tax powers. The provisional block grant adjustment is £11,750m but this figure will be adjusted once outturn figures become available about 15 months after the end of the tax year.
The Scottish Government estimates that its decision to keep the higher rate threshold at £43,000 rather than increasing it to £45,000 will have generated additional revenues of around £150m. The Scottish Government's latest forecast (February 2017) is for NSND income tax revenues of £11,857m.
Taxpayers in Scotland
The distribution of taxpayers in Scotland differs from the UK as a whole, especially at the top end of the income distribution. Across the UK as a whole, almost 40% of income tax is paid by those earning more than £100,000. This compares with only 28% in Scotland.
| Scotland | UK | |
|---|---|---|
| % of taxpayers earning more than £100,000 | 2.0 | 2.6 |
| % of income earned by those earning more than £100,000 | 12.9 | 18.3 |
| % of income tax paid by those earning more than £100,000 | 28.0 | 37.9 |
In Scotland, three local authorities accounted for almost a third of income tax raised in 2014-15: City of Edinburgh, Aberdeenshire and Aberdeen City.
Estimating the impact of tax policy changes
Increasing the basic rate of income tax in Scotland by 1p would be estimated to raise revenues by around £380m. This is before taking account of any behavioural responses that might result from the policy change.
Estimating behavioural responses is challenging due to the limited evidence available and the likelihood that actual responses will reflect the specific economic circumstances and cultural factors at the particular time of implementation.
What is income tax?
UK income tax is a tax imposed on individuals that varies with the taxable income of the taxpayer. Taxable income is defined as gross income for income tax purposes less any allowances and reliefs available at the taxpayer's marginal rate (see Annex 1 for the main taxable and non-taxable benefits). Income tax is divided into graduated rates and is progressive, that is to say high income individuals have a higher marginal rate of tax than lower-income individuals.
UK income tax rates are marginal tax rates. The marginal tax is the percentage taken from the next pound of taxable income and is applied to income within each applicable tax bracket. For example the additional rate of income tax is charged only on taxable income above the threshold of £150,000.
The UK has three main rates of income tax: basic, higher and additional.
Some taxpayers qualify for allowances that reduce their tax liability. The standard Personal Allowance is the amount of tax-free income (£11,500 for 2017-18). This tapers away by £1 for every £2 for taxpayers with "adjusted net incomes" over £100,000 (adjusted net income is total taxable income before any Personal Allowances and less certain tax reliefs such as trading losses and Gift Aid). This means in 2017-18 the allowance is zero for incomes of £123,000 or above. In 2018-19 Personal Allowance is £11,850 which means it will be zero for taxpayers with income £123,700 or above. Other allowances include Marriage Allowance and Blind Person's Allowance.
Income Tax is charged on taxable income minus tax-free allowances.
There are three types of income for income tax purposes:
All income other than savings and dividends. This is often referred to as “earned income” and includes pay from employment but also trading profits from self-employment and unincorporated businesses, pensions (state, occupational and personal), taxable benefits (e.g. Jobseeker’s Allowance) and income from property.
Savings income (e.g. bank and building society interest, interest from unit trusts and open ended investment companies).
Dividends (income from UK-resident company shares, dividends from unit trusts and open ended investment companies).
Rates and bands are set for the tax year. The income tax year is from 6 April to the 5 April the following year. The current tax year is from 6 April 2017 to 5 April 2018, referred to as 2017-18. Note when working out income tax per capita values in the financial year 2017-18, it is standard to take 75% of the Office for National Statistics' (ONS) population in the first year (2017 for tax year 2017-18) and 25% of the population in the second year (2018 for tax year 2017-18).
Scottish income tax: Legislative framework
The following UK Acts make provision about income tax in the UK as a whole:
Income Tax (Earnings and Pensions) Act 2003 (which is about charges to tax on employment income, pension income and social security income)
Income Tax (Trading and Other Income) Act 2005 (which is about charges to tax on trading income, property income, savings and investment income and some other miscellaneous income)
Income Tax Act 2007 (which contains the other main provisions about income tax).
All income tax powers provided to the Scottish Government are in relation to non-savings, non-dividend (NSND) income only, i.e. earnings. Income tax on dividends and savings is reserved to the UK Government. The definition of the income tax base, and personal allowance also remain reserved.
Table 1 shows the NSND income tax powers devolved to Scotland under the Scotland Acts 1998, 2012 and 2016. "rUK" refers to "rest of UK".
| Income Tax powers | |
|---|---|
| Scotland Act 1998 |
|
| Scotland Act 2012 |
|
| Scotland Act 2016 |
|
"Scottish taxpayers"
Section 25 of the Scotland Act 2012 sets out the definition of a 'Scottish taxpayer'. To be a Scottish taxpayer, an individual must first be a UK taxpayer. Scotland must be the part of the UK with which Scottish taxpayers have the 'closest connection'. In order for this to be the case one or more of the following conditions must apply:
they spend at least a part of that year in Scotland; and for at least part of that time spent in Scotland, their principal UK home is located in Scotland and use of it is made as a place of residence. The times in that year when Scotland is where their principal UK home is located comprise (in aggregate) at least as much of that year as the times (if any) in that year when the location of their principal UK home is not in Scotland;
the number of days they spend in Scotland in that year is equal or above the number of days they spend elsewhere in the UK; or
for the whole or part of the tax year they are an MSP, an MP representing a constituency in Scotland, or an MEP representing Scotland. This is regardless of the location in the UK of their main place of residence.
In most cases the key test for Scottish taxpayer status rests on establishing an individual’s place of residence.
Further guidance is provided by HMRC in Scottish Taxpayer Technical Guidance1.
HMRC is responsible for the initial and ongoing determination of whether or not someone is a Scottish taxpayer and identifies them with an 'S' at the beginning of their tax code. HMRC reported in its Annual Report and Accounts 2016-172 that it had issued tax codes to about 2.5 million Scottish taxpayers.
Facts and figures
Scottish income tax policy 2017-18
Table 2 shows NSND income tax rates and bands from 2016-17 to 2018-19.
| Year | Coverage | Personal allowance (PA) | Basic rate limit (BRL) | Higher rate threshold (PA+BRL=HRT) | Additional rate threshold |
|---|---|---|---|---|---|
| 2016-17 | UK (inc. Scotland) | 11,000 | 32,000 | 43,000 | 150,000 |
| 2017-18 | rUK | 11,500 | 33,500 | 45,000 | 150,000 |
| Scotland | 11,500 | 31,500 | 43,000 | 150,000 | |
| 2018-19 | rUK | 11,850 | 34,500 | 46,350 | 150,000 |
| Scotland | 11,850 | TBA/rates may be different | |||
In 2017-18 the UK Government increased the higher rate threshold by 4.7%. The Scottish Government initially proposed to increase it by inflation as measured by CPI as at September 2016 which was 1.0%, in order to generate a real terms freeze in the rate.1 The higher rate threshold would thus have been £43,430.2 The Scottish Government estimated this would have raised £11,829 million in NSND income tax revenues 2017-18.
However, in February 2017 it proposed to freeze it in cash terms at £43,000 as part of an agreement with the Scottish Green party. It stated:3
This change protects basic rate taxpayers while generating an additional £29 million of revenues in 2017/18. And it ensures that 99% of taxpayers on the same income this financial year will not be paying any more income tax in the next financial year (...) For the 10% of people covered by this higher rate the income foregone amounts to around £7.70 a week.
The Scottish Government estimated (in February 2017) that with this higher rate threshold, NSND Scottish income tax in 2017-18 would raise £11,829 + 29 = £11,857 million (the two do not add up due to rounding).
The £2,000 difference in the higher rate threshold means that Scottish higher and additional rate taxpayers pay more than in rUK in 2017-18.
In 2017-18 HMRC estimates there are 365,000 higher rate taxpayers and 21,000 additional rate taxpayers, equal to 386,000 combined higher and additional rate taxpayers in Scotland.4 This is not however the number of people who pay more NSND income tax in Scotland compared to rUK as these figures include some savings and dividends taxpayers who are only raised out of the basic rate due to savings and dividend income. See the section Relationship between total income taxpayers and NSND income taxpayers (higher and additional) for more information on the potential link between total income taxpayers and NSND taxpayers at the higher and additional rate in Scotland based on 2014-15 SPI Public Use Tape data.
The UK Government announced income tax rates and bands as well as allowances in the Autumn Budget 20175 (Table 2). The Scottish Government will set out its income tax proposals for 2018-19 on 14 December 2017, in the Draft Budget 2018-19.
The UK Government is committed to raising the personal allowance to £12,500 and the higher rate threshold to £50,000 by 2020.5
Scottish income tax - Illustrative examples for 2017-18
A taxpayer with £35,000 of taxable income will pay only the basic rate of income tax and will pay tax on £35,000 – £11,500 = £23,500. Their tax is 23,500 * 20% = £4,700. This is equal to 13.4% of their taxable income.
A taxpayer with £50,000 of taxable income is a “higher rate taxpayer” and is taxed on £50,000 - £11,500 = £38,500. They pay the basic rate on £31,500 (equal to £6,300) and the higher rate on £39,400 - £31,500 = £7,000 (equal to £2,800). Altogether they pay £9,100 in tax. This is equal to 18.2% of their taxable income.
A taxpayer with £200,000 of taxable income is an "additional rate taxpayer" and has no personal allowance. They pay the basic rate of tax on £31,500 (£6,300), the higher rate on £150,000 - £31,500 = £188,500 (£47,400) and the additional rate on £50,000 (£22,500), so in total their tax is £76,200. This is equal to 38.1% of their taxable income.
Savings and dividend income is taxed as the highest part of a person’s total income and dividend income is taken as the highest part of the combined amount if a person has both savings and dividend income. Therefore the first slice of a person’s income comprises earnings, pensions, taxable social security payments, trading profits and income from property. The next slice is savings income and dividend income is the top slice.7
The marginal tax rate is the tax rate paid on an additional pound of earned income. This is different from the average tax rate, which is the ratio of income tax liability to total income, where income is measured before deductions, reliefs and allowances. Deductions, allowances and tax credits vary across individuals leading to differences in individual average tax rates over and above differences in individual incomes.
The overall average income tax rate in the UK is 16.5% in 2017-18, down from 17.2% in 2015-16 and 17.4% in 2012-13.8
Taxpayers in Scotland in 2017-18
The following data is taken from the Survey of Personal Incomes (SPI) 2014-15. (SPI), an annual HMRC survey based on a sample of 600,000 individuals drawn from their PAYE, self-assessment and Claims systems. There is also a Public Use Tape of the SPI, currently available for 2014-15 available in the UK Data Archive. This is however only available with a long time lag - the 2014-15 SPI was released on 7 September 2017.
HMRC provides income tax and taxpayer number estimates up to 2017-18 using economic assumptions consistent with the OBR’s March 2017 economic and fiscal outlook.
Note the figures below are for Scottish income taxpayers - this is not the same as Scottish NSND income taxpayers as HMRC include some savings and dividends taxpayers who are only raised out of the basic rate due to savings and dividend income. These would have to be stripped out to obtain the exact number of taxpayers paying more NSND income tax in Scotland compared to rUK.
Table 3 and Figure 1 show the estimated number and share of taxpayers in the UK and Scotland by highest marginal rate in 2017-18.1
Note the number of "higher rate taxpayers" is not directly comparable in Scotland and rUK: it includes Scottish taxpayers with taxable incomes between £31,500 and £33,500, but rUK taxpayers with taxable incomes over £33,500 only (and under £150,000 in both cases).
Note "savers" are taxpayers with no taxable earnings and total taxable income from savings charged at 20% and/or dividends at 7.5%.
In 2017-18, there are 30.3 million taxpayers in the UK, 2.6 million of which are in Scotland (8.5% of taxpayers in the UK as a whole). In comparison, the UK population mid-2016 (latest data available) was 65.6 million and Scotland’s population was 5.40million, equal to 8.2% of the total UK population.2 Just under half of Scotland's population are income taxpayers. This uses mid-2016 population estimates (5,404,700)3 and 2016-17 Scottish income taxpayers (2,580,000).1
The share of taxpayers at both the "savers" rate and the additional rates in Scotland is a third lower than in the UK as a whole, while there is a slightly higher share of basic and higher rate taxpayers (the latter is partly due to the higher rate threshold being lower in Scotland). "Savers" are taxpayers with no taxable earnings and total taxable income from savings between the starting rate limit and the basic rate limit and/or dividends at the 10p ordinary rate.
| Number | |
|---|---|
| Savers | 36,000 |
| Basic | 2,150,000 |
| Higher | 365,000 |
| Additional | 21,000 |
| Total | 2,570,000 |
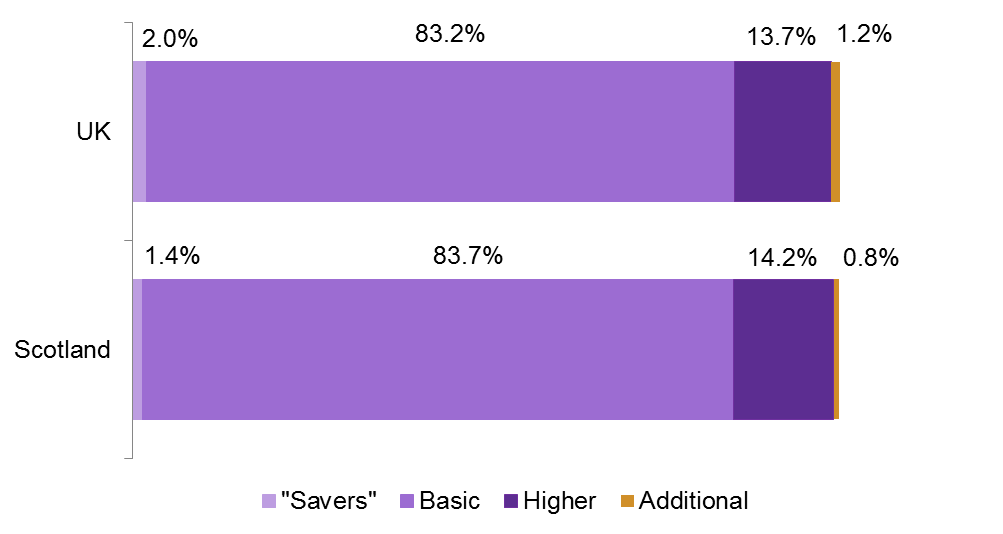
Table 4 shows the change in the number of taxpayers at the basic, higher and additional rates since 2010-11 (the year the additional rate was put in place). This is caused by changes in the taxpayer base (demographics and income) as well as policy changes. Only the additional rate threshold has stayed the same since 2010-11 (£150,000). Note that these percentages are estimates as they are based on rounded figures published by HRMC.1 While the number of basic rate taxpayers has decreased (mainly as a result of personal allowance rising), the number of higher and additional rate taxpayers has increased significantly since 2010-11. In Scotland the number of additional rate taxpayers has almost doubled since 2010-11.
| All taxpayers | Basic | Higher | Additional | |
|---|---|---|---|---|
| UK | -3.2% | -7.0% | 37.7% | 54.2% |
| Scotland | -5.5% | -11.2% | 57.3% | 90.9% |
Men represent more than half of taxpayers (Table 5) in both the UK and Scotland, although in Scotland, a slightly higher share of taxpayers are female compared to the UK as a whole.
| Men | Women | |
|---|---|---|
| Scotland | 56.4% | 43.6% |
| UK | 58.4% | 41.6% |
Table 6 shows the change in the number of female and male taxpayers in Scotland and the UK as a whole since 2010-11.
| Men | Women | |
|---|---|---|
| Scotland | -0.7% | -11.1% |
| UK | 1.7% | -8.7% |
Therefore the share of women taxpayers is smaller than it was in 2010-11 (46.3% of taxpayers in 2010-11 in Scotland were women).
The number of taxpayers 65 and over in Scotland has risen by 25% since 2010-11 and Scotland has a slightly lower share of older taxpayers compared to the UK as a whole: 20.7% of taxpayers in Scotland are 65 and over, compared to 21.1% in the UK. In 2010-11 only 15.6% of taxpayers were 65 and over.
Taxpayers by income bracket, 2014-15
The following uses published HMRC analysis of the SPI 2014-15.1233 Note this is total income taxpayers - which as already explained elsewhere in this briefing is different to NSND income taxpayers. See the section Relationship between total income taxpayers and NSND income taxpayers for more information.
Figure 2 shows the share of taxpayers (numbers) by income bracket (lower limit) in Scotland and the UK as a whole.

Figure 3 shows the share of taxpayers' income by income bracket (lower limit) in Scotland and the UK as a whole. Note Figure 2 looks at numbers of taxpayers while Figure 3 looks at taxpayer's total income.

Figure 4 shows the share of taxpayers' income tax by income bracket (lower limit) in Scotland and the UK as a whole. Note this is total tax, while Figures 2 and 3 relate to taxpayer numbers and total income.
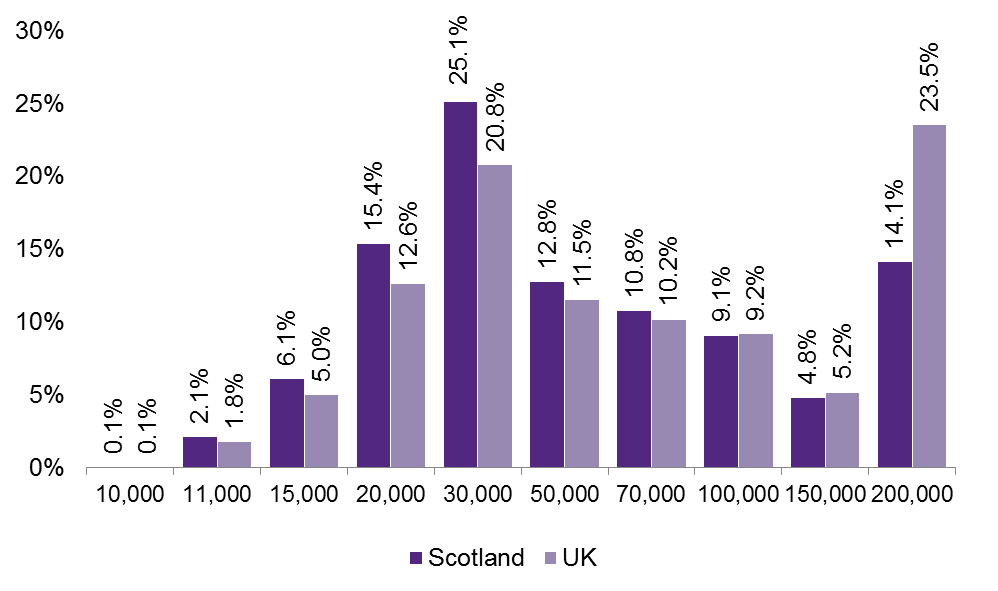
Figures 2, 3 and 4 show that taxpayers, their income and income tax are more equally distributed in Scotland than in the UK as a whole. This is most apparent with total income tax paid in each income bracket. For instance, in Scotland those earning over £200,000 a year pay 14.1% of total income tax while in the UK as a whole they pay 23.5%.
Gender breakdown
The following data is taken from HMRC's Table 3.11. Figure 5 shows the proportion of men-women by type of income in 2014-15. Men make up 55.4% of total income taxpayers in Scotland and over 70% of taxpayers who have self-employment income in Scotland.
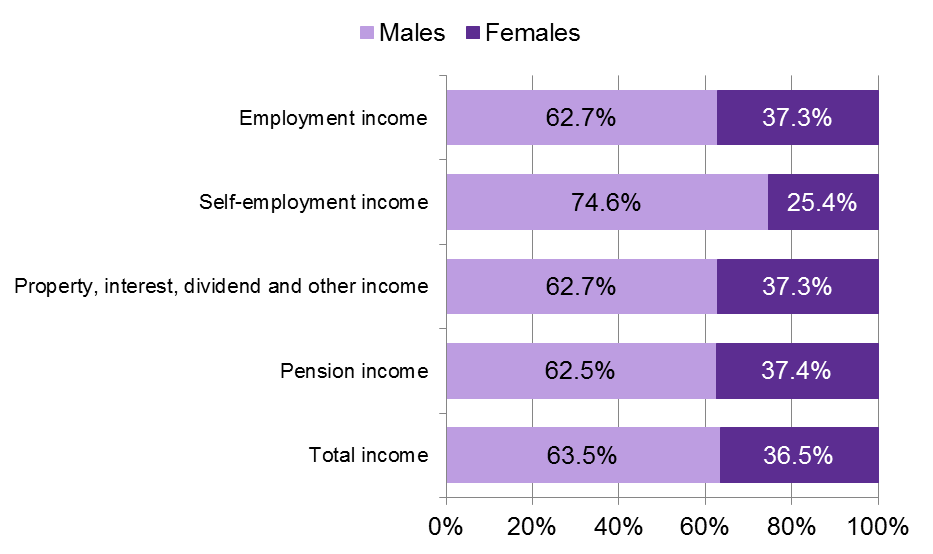
Figure 6 shows the proportion of total income by men/women for different income types in 2014-15. Men account for 55.4% of total taxpayers in 2014-15 (the figure is 57.3% in the UK as a whole) and hold 63.5% of total income (compared to 65.5% in the UK as a whole).
In 2017-18 (HMRC's Table 2.2) HMRC project that in Scotland, 56.4% of total income taxpayers will be men and 43.6% female.

Men account for 71.0% of total income tax paid in Scotland in 2014-15 (in the UK as a whole this is 72.5%) while women in Scotland account for 29.2% of income tax (in the UK as a whole this is 27.2%) (percentages do not add up to 100% due to rounding).
Local authority breakdown
Figure 7 shows mean income tax in each local authority relative to the Scottish average. At £7,830, the mean tax take in Aberdeen City is 70.6% higher than Scotland as a whole (£4,590), followed by Aberdeen City where it is 54.9% higher (at £7,110), and Edinburgh where it is 42.3% higher (at £6,530). It is lowest in Dumfries and Galloway, and Dundee, where it is a third lower than the Scottish average.
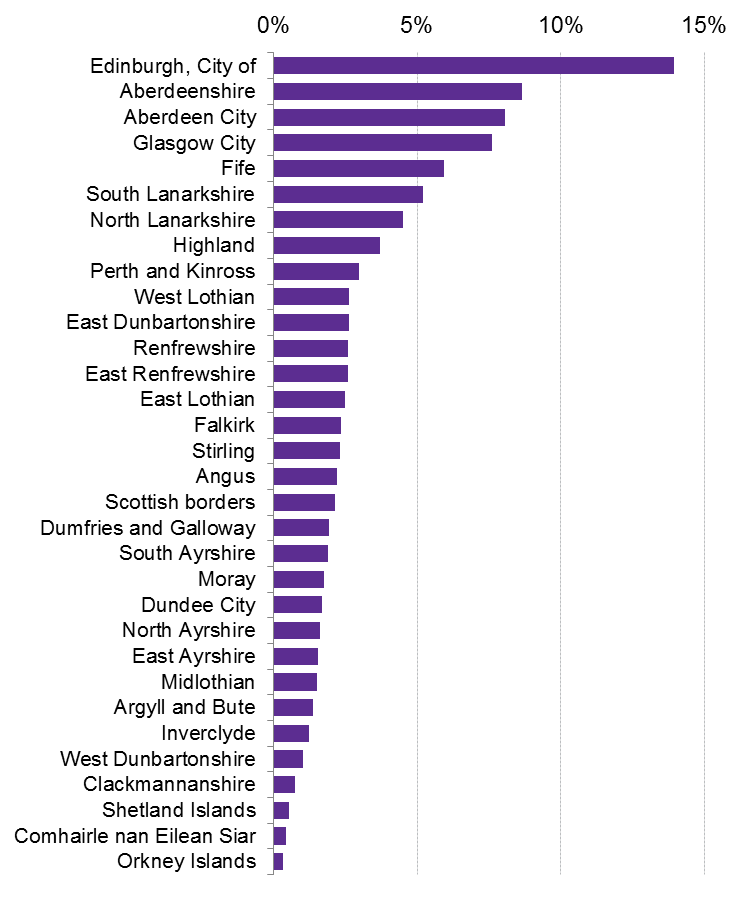
Figure 8 shows the share of income tax raised by each local authority in 2014-15. Edinburgh raises the highest share, at 13.9%, followed by Aberdeenshire at 8.7% and Aberdeen at 8.1%.

Relationship between total income taxpayers and NSND income taxpayers (higher and additional)
The following data is based on SPICe analysis of the SPI Public Use Tape 2014-15.
Figure 9 shows the breakdown of taxpayers by type, at the higher and additional rates in Scotland in 2014-15.
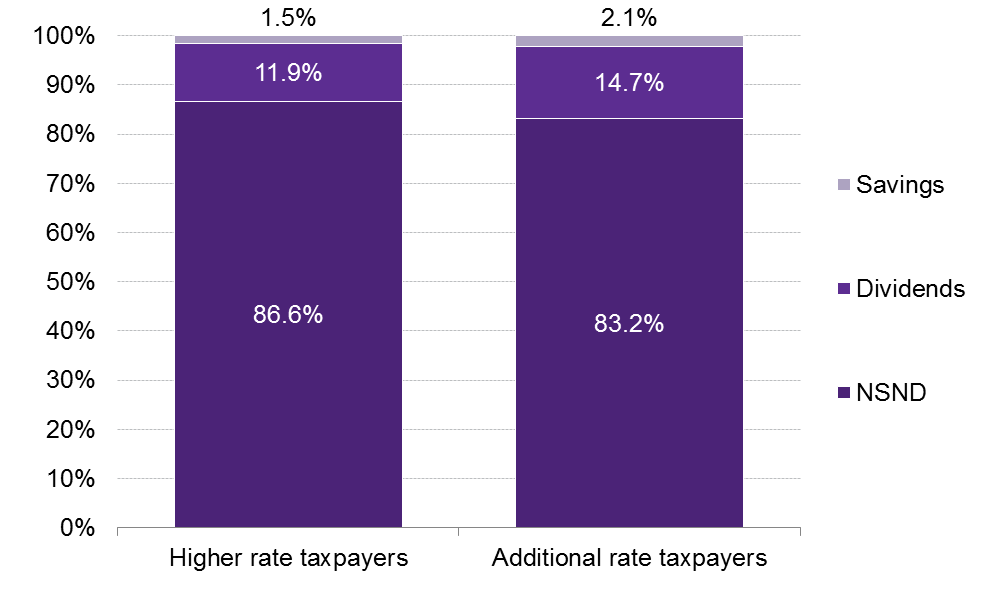
There are an estimated 365,000 higher rate taxpayers and 21,000 additional rate taxpayers in Scotland in 2017-18, equal to 386,000 combined higher and additional rate taxpayers.1
Table 8 provides an illustrative example of the potential number of taxpayers affected by the higher rate threshold in Scotland in 2017-18, assuming the balance of taxpayers was the same in 2014-15 (Figure 9) as in 2017-18.
| Higher | Additional | Total | |
|---|---|---|---|
| 2017-18 | 365 | 21 | 386 |
| 2014-15 share of NSND taxpayers | 86.6% | 83.2% | |
| Illustrative example of number of NSND higher and additional taxpayers in 2017-18 | 316 | 17 | 334 |
Analysis of NSND additional rate taxpayers in Scotland, 2014-15
The following data is based on SPICe analysis of the SPI Public Use Tape 2014-15. It considers only NSND taxpayers classified as additional rate taxpayers in the SPI.
There were 18,000 additional rate taxpayers in Scotland in 2014-15. This is taxpayers with total taxable income above the higher rate limit (£150,000). Of these, 83.2% were NSND additional rate taxpayers as shown in Figure 9.
Figure 10 shows the the distribution of NSND additional rate income taxpayers and their income tax by industry.
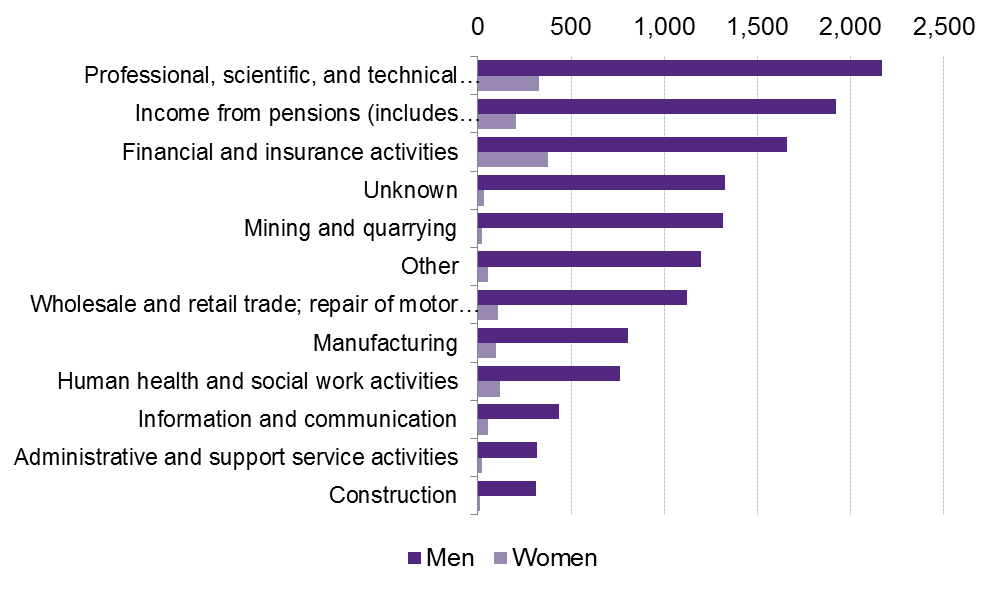
Figure 11 shows the number of NSND additional rate taxpayers by industry type and by gender in 2014-15.

For NSND additional rate taxpayers, all the industry categories have more than 80% men in 2014-15, except in the category "Other (income from financial investments, property, unemployment benefit, incapacity benefit, and other Social Security benefits)" where 33.6% of NSND additional rate taxpayers are women. Financial and insurance activities also has a relatively high percentage of women, at 18.5%; and human health and social work activities, at 13.6%.
Scottish income tax revenue 2016-17 to 2022-23
Figure 12 shows estimated NSND income tax in Scotland from 2016-17 to 2022-23.
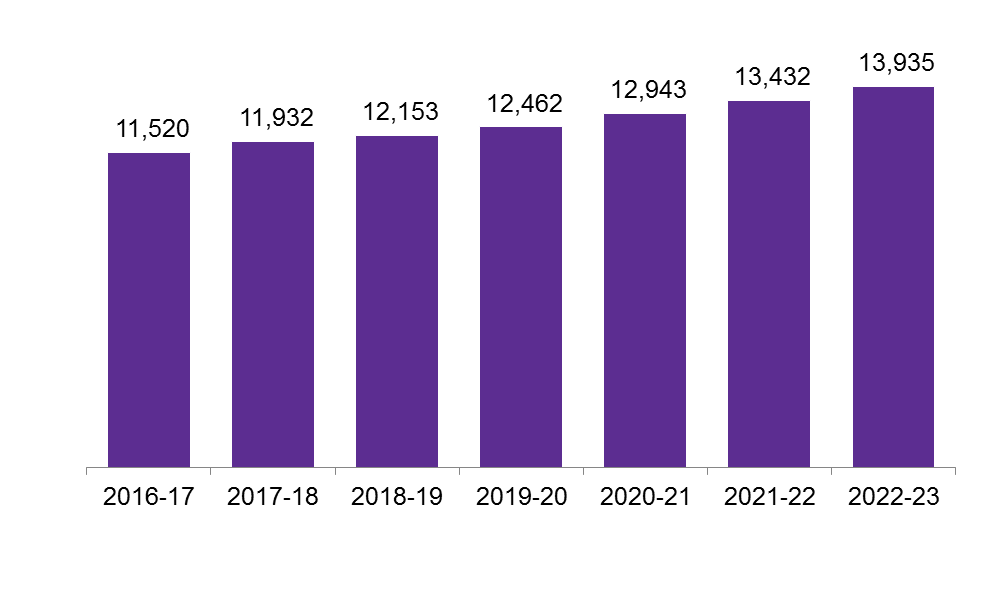
Income tax revenues were higher-than-expected in 2016-17 in the UK according to the OBR23, including Scotland. This is down to bonuses in both the financial and non-financial sectors being stronger than anticipated. The OBR's forecasts assume bonuses will be higher in future years too.1
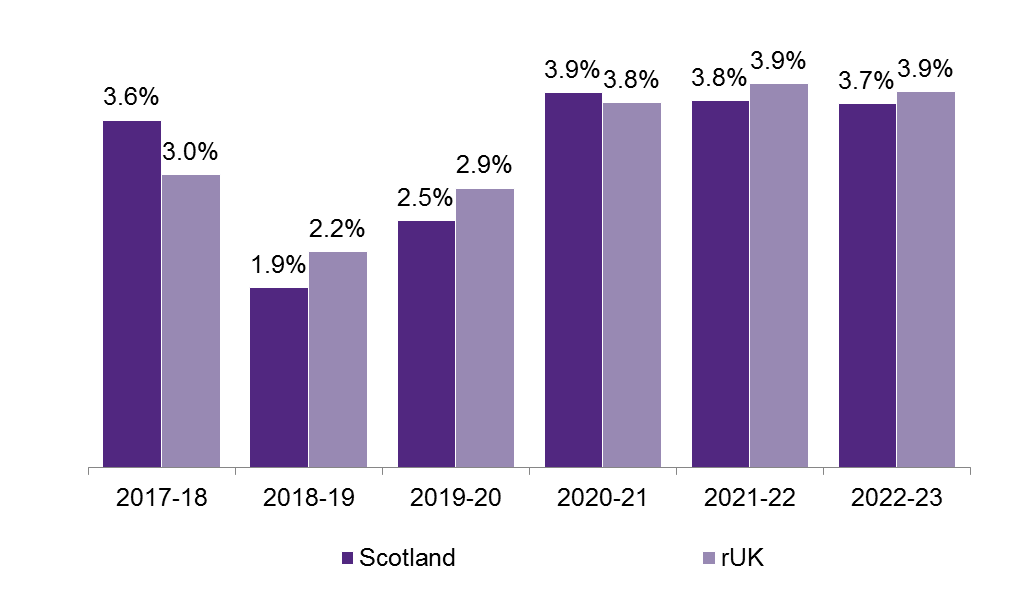
Figure 13 shows the annual percentage growth in estimated NSND income tax revenues in Scotland and rUK.
HMRC, auditing and costs of implementation
Income tax continues to be administered and collected by HMRC across the UK including Scotland.
The Comptroller and Auditor General (C&AG) is required for each financial year to report on HMRC's administration and collection of Scottish income tax, including reimbursements from the Scottish Government. It has so far published:
The administration of the Scottish Rate of Income Tax 2014-151 (November 2015)
The administration of the Scottish Rate of Income Tax 2015-162 (December 2016)
The administration of the Scottish Rate of Income Tax 2016-173(December 2017)
The Fiscal Framework specifies that the Scottish Government will reimburse the UK Government for costs associated with income tax changes.
Final total costs of implementing Scottish income tax (including SRIT) will be £20-25 million for SRIT, plus an additional £2.6 million for further Scottish income tax.4
Interaction with other parts of the UK tax system
Savings and dividends
In 2017-18, Scottish taxpayers with total earnings above the Scottish higher rate threshold (HRT) (£43,000) but below the UK Government’s HRT (£45,000) pay the higher rate on their NSND income within this band, whereas savings and dividends income is taxed at the basic rate because taxation of savings and dividends income is determined by the UK Government.
Capital Gains Tax
Taxpayers are treated differently for Capital Gains Tax (CGT) purposes depending on which UK income tax band they are in - not Scottish tax band. In 2017-18, higher rate Scottish taxpayers with earnings between £43,000 and £45,000 are treated like basic rate taxpayers for CGT purposes. Higher or additional rate taxpayers (based on UK tax bands) pay 28% on their gains from residential property and 20% on their gains from other chargeable assets, while the rate for basic rate taxpayers depends on various factors such as the size of their taxable income and size of the gain from selling the asset.1
The rules that determine an individual’s principal private residence are different from the rules that determine Scottish taxpayer Status.
National Insurance Contributions
Table 9 shows the difference between income tax and income tax + employee national insurance contributions in Scotland and rUK in 2017-18.
| Income (£) | Up to 8,160 | 5,892 to 11,500 | 11,500 to 43,000 | 43,000 to 45,000 | 45,000 to 100,000 |
|---|---|---|---|---|---|
| Scotland just income tax | 0% | 0% | 20% | 40% | 40% |
| rUK just income tax | 0% | 0% | 20% | 20% | 40% |
| 0% | 12% | 12% | 12% | 2% | |
| Scotland including NICs | 0% | 12% | 32% | 52% | 42% |
| rUK including NICs | 0% | 12% | 32% | 32% | 42% |
In Scotland, employees with incomes between £43,000 and £45,000 have an effective tax rate of 52% at the level of income when NSND income tax and employee NICs are counted together - while in rUK the rate is 32% for comparable taxpayers. This is because the NICs thresholds are in line with UK Government income tax thresholds. As a consequence, the 12% rate of NICs is payable for all UK taxpayers until they reach earnings of £45,000 when it falls to 2%. For taxpayers in rUK, these thresholds also relate to when the higher rate of income tax becomes payable. However, for Scottish taxpayers, due to the difference in the HRT, there is a band between £43,000 and £45,000 where individuals will be liable for both the higher rate of income tax and the higher rate of NICs.
Pensions
Tax relief is given for most pension contributions. Personal pension contributions are made after tax, and the pension scheme administrator (PSA) claims relief at source (RAS) from HMRC. Note the RAS is paid at the basic rate.
If Scottish and rUK income tax differs, Scottish and rUK taxpayers will receive a different rate of relief at source on their personal pension contributions. HMRC must notify pension providers of the correct rate of income tax for their scheme members from April 2018 - ministers having agreed to a two-year transitional period (2016-17 and 2017-18) to allow for the industry to prepare its systems for Scottish income tax.1 The NAO notes:
The ability to provide an IT solution allowing personal pension providers to claim relief at source continues to be a significant risk going forward. Similarly, a significant challenge to HMRC successfully providing the correct taxpayer status is data matching. HMRC’s estimates suggest that there is a 4% non-matching rate due to errors in, or omission of, National Insurance numbers on pension provider returns.
Additionally, there are other ways of getting pensions relief, such as Self-Assessment and net pay.
Marriage Allowance
The Marriage Allowance became available from 2015-16 for basic rate taxpayers. This allows the transfer of 10% (£1,150 in 2017-18) of the tax free Personal Allowance between couples who are married or in civil partnerships, were born after 6th April 1935 and one partner has an annual income of £11,500 or less, plus up to £5,000 of tax-free savings interest and the other partner's annual income is between £11,501 and £45,000 in rUK and £43,000 in Scotland.1
Past and potential issues with income tax in Scotland
Taxpayer identification
There were 2.45 million individuals who were issued with a Scottish taxpayer notification letter in 2015-16.1 The National Audit Office subsequently reported that 420,000 Scottish taxpayers had potentially been excluded from the initial identification, but received a Scottish tax code early in 2016-17.
Tax avoidance/evasion
HMRC’s compliance strategy identifies the following ways taxpayers could avoid Scottish income tax, or pay the incorrect amount:1
Failure to maintain address.
Deliberate manipulation of address.
Converting income to capital receipts, or incorporating a business.
HMRC's risk strategy currently identifies three taxpayer groups in terms of the tax evasion risk they pose:1
Those with a net worth of £20 million.
Those earning over £150,000 annually or with a net worth of £1 million.
All other taxpayers.
Behavioural responses
Types of responses
Tax changes have two effects:
The mechanical effect is the direct effect, all other things being equal. For instance, a 5% tax rise leads to a 5% increase in tax revenue if taxpayers do not change their behaviour. This effect leads to the pre-behavioural tax yield.
The behavioural effect is caused by behavioural responses i.e. changes in taxpayers’ behaviour in order to minimise their tax burden.
Adding both the mechanical and behavioural effects provides the post-behavioural tax yield. The more people react to a tax change, the greater the difference will be between the pre and post-behavioural tax yield.
Behavioural responses cause income tax receipts to be lower than expected (and also theoretically higher). This may have an impact on the Scottish budget not only through revenue outturn, but also through BGAs and the differential growth rate of income tax revenue per head. For instance, if a Scottish tax proposal causes wealthy taxpayers to move to England, this increases income tax revenue in England, which may in turn increase the BGA at the very time Scottish income tax revenues are decreasing. This is theoretically more damaging to the Scottish budget than Scottish taxpayers shifting their income from earnings to dividends. This would mean they pay dividend tax to the UK Government instead of Scottish NSND income tax but has no impact on the BGA.
Behavioural responses include:
Changes to the labour supply (numbers of hours worked or effort put into work).
Early or deferred retirement.
Choosing a career that has a higher/lower remuneration.
Migration. The labour mobility of highly skilled workers has increased in the last 15 to 20 years as the legal impediments and general migration costs have reduced. In a UK survey by the Skandia life assurance company in 2011, 31% of respondents cited high taxation as the most frequently cited reason for considering leaving the UK.1
Changes to the nature of income including:
Converting income to capital gains.
Incorporating and converting earnings to dividends.
Increasing contributions to private pensions.
Increasing charitable contributions.
Transferring income between spouses.
Changes to the timing of income: Forestalling (when income is brought forward) or delaying income
Measuring behavioural responses
Behavioural responses are measured using elasticity. This measures the change in the tax base (what is being taxed) after a tax change due to behavioural responses.
For income tax, this indicator is called taxable income elasticity (TIE). It measures the change in taxable income due to behavioural responses.1This became a popular way of assessing behavioural responses in the mid-1990s. With TIE, it is not necessary to separately measure all the underlying behaviours that influence taxable income.2
TIE estimates the change in reported income in response to a 1% change in the net-of-tax rate. The net-of-tax-rate is the proportion of each additional pound earned received by the individual after tax e.g. if the tax rate is 30%, the net-of-tax rate is 70%.
For example, a TIE of 0.4 implies that a 1% change in the net-of-tax rate will lead to a fall in total taxable income of 0.4%. TIE doesn’t just take into account a change in the marginal rate of income tax. It looks at the change in the average rate of tax for a taxpayer – this includes all the tax rates they are liable to (e.g. basic and higher for higher rate taxpayers) as well as their national insurance contributions.
High income taxpayers, the self-employed, secondary earners in households, as well as taxpayers in systems where itemized deductions are available (e.g. charitable donations) tend to have the highest TIEs although there is substantial variation in TIEs depending on the study.3While many studies cite TIEs of 0.4 as a reliable estimate for high income taxpayers4 other studies point to the difficulties in applying the "correct" TIE in a given situation.
It is very difficult to estimate behavioural responses.
Behavioural studies look at tax changes in the past including changes to the tax base and to tax revenue, with the aim of isolating the behavioural effect. This means stripping out other factors are also involved such as the state of the labour market, standards of living, etc.
Using these studies to predict future behavioural responses is problematic. Even two identical tax changes (for example, setting the 45p additional rate of income tax at 50p) will cause different behavioural responses in different tax jurisdictions or at different points in time. This is because two circumstances are never identical. There may have been:
Other changes to the rest of the fiscal system. For instance, in 2008 Robert Chote, then director of the IFS, argued that the decision to withdraw personal allowance for people on high incomes was as important a change as the proposal to introduce an additional rate of income tax at 45p (from a higher rate 40p) especially from the perspective of the incentives created by the tax structure for people to change their behaviour.5
Changes in the economy and aggregate shocks that cause varying income trends which are hard to disentangle from tax-induced behavioural responses.
Changes to regulations such as anti-avoidance measures (different opportunities for taxpayers).
Changes in composition of tax-paying population.
Differences in cultural factors when comparing different countries.
For instance, when estimating TIEs, HMRC stated in relation to US studies:6
While all of these studies suggest a TIE of at least 0.5, they are based on the US income tax system which is widely considered to have a narrower base than in the UK and greater opportunities for tax planning. This suggests a slightly lower estimate for the UK with its broader income tax base and disclosure regime.
Permanent changes in behaviour lead to a permanent loss of tax revenue for the tax that has been changed but also for other taxes. For instance, if a taxpayer migrates, they reduce some if not all of their spending in the country and this causes a decrease in consumption taxes.
Temporary changes in behaviour cause a temporary decrease in tax revenue (but can also cause revenue to be permanently lower). For instance, forestalling involves receiving income before a tax increase comes into force, therefore increasing the previous year's tax revenue (and decreasing overall potential tax revenues as the forestalled income is taxed at a lower rate).
Behavioural responses to a tax change can affect the tax yield of that tax, but also that of other taxes. A sole trader may decide to incorporate to shift self-employment income from earnings to dividends for instance.
The fiscal framework and behavioural responses
The Smith Commission set out the principle of “no detriment”:
There should no detriment purely as a result of devolution.
There should be no detriment to either the UK or the Scottish Government as a result of the other government’s policy decisions post-devolution. Where either government makes a policy decision that affects the tax receipts or expenditure of the other, the decision-making government will either reimburse the other if there is an additional cost, or receive a transfer from the other if there is a saving.
The fiscal framework states:1
Behavioural effects that impact tax revenues can be taken into account where, in exceptional circumstances, they are demonstrated to be material and both governments agree that it is appropriate to do so.
Case study: the 50p additional rate
The introduction of an additional rate of income tax at 50p was proposed in April 2009 for implementation in April 20101 Table 10 shows the UK Government’s forecast revenue for the 50p rate between 2009 and 2010.
| 2010-11 | 2011-12 | 2012-13 | |
|---|---|---|---|
| 2009 Budget1 | 1,130 | 1,810 | n/a |
| 2010 Budget3 | 1,300 | 3,050 | 2,660 |
The UK Government used a TIE of 0.35 for its 2010 forecast. HMRC noted that this was deliberately at the low end of the academic elasticities surveyed.4
If there had been no behavioural response, the Institute for Fiscal Studies estimated that the 50p rate would have raised £6.5bn in 2012-13.3 This compares to the UK Government’s £2.7bn.
Tax returns for 2010-11 had to be submitted at the latest by early January 2012. In March 2012, HMRC produced an assessment of the 50p rate and noted:4
The analysis shows that a considerable behavioural response to the rate change, including a substantial amount of forestalling: around £16 billion to £18 billion of income is estimated to have been brought forward to 2009-10 to avoid the introduction of the additional rate of tax (…) The modelling suggests the underlying behavioural response was greater than estimated previously in Budget 2009 and in March Budget 2010, decreasing the pre-behavioural yield by at least 83 per cent.
In his 2012 Budget speech in March 2012, the Chancellor George Osborne stated:7
HMRC finds that an astonishing £16 billion of income was deliberately shifted into the previous tax year, at a cost to the taxpayer of £1 billion—something that the previous Government’s figures made no allowance for whatsoever. Self-assessment receipts this year are below forecast by some £3.6 billion, while other tax receipts have held up. The increase from 40p to 50p raised just a third of the £3 billion that we were told it would raise.
In 2012 HMRC noted:4
The evidence on the impact of the 50 per cent rate on migration since its introduction in 2010 is more qualitative and anecdotal at this stage.
This includes a 28% increase from the previous year in the number of British citizens working in the banking and financial services who moved to Switzerland in 2010 and a 29% increase in long-term work permits in 2010.4 See Annex 1 for a case study of behavioural responses in Switzerland.
HMRC also discussed the effect of cutting the 50p rate to 45p. The IFS summarised their results:10
This [paper] suggested that cutting the 50p rate to 45p could reduce revenues by about £3.5 billion in 2015–16 if there was no change in behaviour by affected individuals. However, once one allows for behavioural response, their central estimate was a cost of just £100 million – a very small amount of money. The best available estimate of what reversing the cut would raise is therefore about £100 million too. However, it is important to bear in mind that there is substantial uncertainty around this central estimate (…) HMRC’s central estimate is that this elasticity was 0.45 (…) If instead the true elasticity was 0.35 (which is well within the range of uncertainty), reducing the top rate of tax from 50p to 45p will have cost the exchequer about £700 million, whilst if the true elasticity was 0.55 (again, within the range of uncertainty), it will have actually raised about £600 million.
A 50p additional rate in Scotland?
Scottish additional rate taxpayers account for 5.4% of additional rate income taxpayers in the UK in 2017-18,12 much less than its population share (8.2%).
The Scottish Government published in March 2016 an analysis of the setting the 45p additional rate at 50p in Scotland. Table 11 shows the illustrative estimates of the expected impact on Scottish NSND income tax revenues if there were a 50p additional rate in Scotland and a 45p additional rate in the rUK in 2017-18.
| Static | Low behavioural response (TIE: 0.35) | High behavioural response (TIE: 0.75) | |
|---|---|---|---|
| Amount (£m) | 110 | 50 | -30 |
The Scottish Government stated:3
“…if 1,000 (6%) additional rate taxpayers in 2017/18 reduced their tax liabilities to zero, out of an expected additional rate taxpayer population of 18,000, this would result in the policy change raising no extra revenue. In the high behaviour scenario where there would be revenue loss of £30m this would be caused by 1,300 additional rate taxpayers leaving Scotland, or 7% of the additional rate taxpaying population.
For someone earning £1 million per year an increase in the top rate of tax to 50p would cost them an extra £42,500 per year, or around 4% of their income. If such a taxpayer either left Scotland, or in some other way managed to avoid paying income tax in Scotland, the loss in revenues in Scotland would be almost £440,000.
It concluded:3
There is therefore likely to be a significant revenue risk associated with increases to the Scottish additional rate of income tax above that applicable in the rest of the UK. A further risk will impact on future tax revenues where an increased additional rate of tax reduces the attractiveness of locating in Scotland in the future and reduces the potential economic and tax growth rates.
Block grant adjustment
HMRC pay Scottish income tax revenues into the UK Consolidated Fund. These revenues are then transferred to the Scottish Government and the Scottish block grant is reduced accordingly. The details of this arrangement are set out in the The agreement between the Scottish government and the United Kingdom government on the Scottish government’s fiscal framework 1('the fiscal framework'). This applies from 2017-18 onwards.
Adjustment to the block grant in 2016-17
Prior to the fiscal framework agreement, the BGA in respect of SRIT for 2016- 17 was set equal to the OBR's forecast SRIT revenue (£4,900m).1 This amount flowed from HM Treasury into the Scottish Government's Consolidated Fund.
2016-17 is a transitional year of implementation of SRIT. Because no change in rates was made in 2016-17 (SRIT as set at 10p), the net effect of this block grant adjustment (BGA) was zero - the OBR’s forecast for SRIT revenues were notionally taken off the block grant and automatically added on to the Scottish budget.
The revenue added to the Scottish budget was therefore equal to the reduction in the block grant and the net effect on the Scottish budget was 0. There will be no reconciliation to this adjustment once outturn data becomes available because of the agreement that the UK Government bears forecasting risks in the initial transitional period. The Scottish Government's spending power in 2016-17 was therefore unaffected by forecast or actual receipts from SRIT.2
The OBR estimated in November 2017 that SRIT revenues were £4,597 million (£303 million lower than the BGA), down from its March 2017 estimate that 2016-17 revenue would be £4,597 million.3
The fiscal framework and block grant adjustment
The block grant continues to be determined by the Barnett Formula. There will be an annual 'block grant adjustment' (BGA) for each devolved (and assigned tax) including income tax. For income tax, this will be calculated using:
An 'initial baseline deduction', equal to NSND income tax revenue the year prior to devolution (2016-17). Note the baseline adjustment is the revenue for the tax the year before its devolution. With income tax, this corresponds to NSND income tax actually raised in 2016-17 from Scottish taxpayers. This is because the Scottish Government set SRIT at 10p, leaving income tax the same in Scotland and rUK.
An 'indexation mechanism': this incorporates population growth in Scotland and rUK, as well as the growth in ‘comparable revenues’ in rUK. The OBR publishes rUK NSND income tax revenues in Devolved Taxes Forecast.
Each year, both Scottish income tax receipts and the BGA will initially be based on a forecast and then reconciled to actual receipts collected which will become known around 15 months after the end of the financial year in question. The actual reconciliation will take place at Autumn Budget and impact the following tax year (ordinarily) and will not be an in year adjustment in the Summer immediately when outturn data becomes available.
Over the period to 2020-21, the indexation mechanism for the devolved taxes will be based on the ‘Comparable Method’ (CM), but then reconciled to the 'Indexed Per Capita' (IPC) method. The main difference between the two methods is the way they account for relative population growth between Scotland and rUK.
The IPC method indexes the BGA to the growth in tax revenues per capita in rUK and the rate of population growth in Scotland. For example, if rUK revenues per capita grow by 5% and the Scottish population grows by 1%, the BGA grows by approximately 6%. The precise rate of growth of the BGA is 6.05%, calculated as (1.01)*(1.05)*100 – 100.1
In-year estimates of income tax receipts are imprecise due to:
HMRC's end-of-year reconciliation in the pay-as-you-earn (PAYE) process to see whether people have paid too much/too little
The timing of self-assessment returns which, in some cases, are provided to HMRC until 10 months after the end of the tax year to which they relate
The fiscal framework states that the Scottish Government will have access to Scottish income tax receipts as they are received by HMRC.
Role of the Scottish Government/Scottish Fiscal Commission and OBR in forecasting Scottish income tax
Income Tax forecast by the Scottish Government for 2017-18, and the Scottish Fiscal Commission (SFC) from 2018-19 onwards, is the amount available to the Scottish Government to draw down from Treasury throughout that year.
In February 2017 the Scottish Government forecast Scottish NSND income tax revenues for 2017-18 at £11,857 million and this is what was available to the Scottish Government. Until reconciliation to outturn data occurs (outturn data will be available about 15 months after the end of the financial year and actual reconciliation will take place at the Autumn Budget), the net impact on the Scottish budget after the BGA relating to income tax is therefore £107m in additional revenue for 2017-18.
The OBR also forecasts NSND income tax in the UK and Scotland in Scottish tax forecasts1 published alongside Economic and Fiscal Outlooks.2 The rUK figures feed into the annual indexation of the BGA in relation to income tax. In November 2017, the OBR estimated Scottish 2017-18 NSND revenue would be £11,932 million.
The Scottish Government and the OBR have a slightly different methodology to forecast NSND income tax. The OBR's methodology was set out in 2012 in Forecasting Scottish taxes.3
Differences between the Scottish Government and the OBR's forecasts are due to differences in the timing of the forecast, and methodological differences. The OBR has a "top-down" approach and derives the Scottish tax forecast by applying the Scottish share (based on historical shares) to their projection of the UK tax base.3 This is because the macroeconomic data that the OBR would need to produce a Scottish macroeconomic forecast and economic determinants is generally not available at a Scottish level or is only available with a long lag.3
The Scottish Government's methodology for 2017-18 was set out in Devolved Taxes Forecast Methodology6. The income tax model is "bottom up" in that the Government projected the Scottish tax base forward using assumptions about future growth in NSND income and the number of Scottish taxpayers.
For 2018-19 onwards, as stated above, the SFC will produce forecasts for Scottish onshore GDP, Income Tax, devolved taxes, non-domestic rates, devolved demand-led social security payments for 2018-19 onwards. It is required to produce at least two, five-year forecasts a year.
The SFC set out their Current Approach to Forecasting September 20177. The methodology is similar to the Scottish Government's and uses the same macroeconometric forecasting model, “SGGEM” which was built by the Scottish Government and the National Institute of Economic and Social Research (NIESR). It is owned by the Scottish Government and is used by the SFC who put their own assumptions in it.7 The Protocol for engagement between the Scottish Fiscal Commission and the Scottish Government 9 sets out the timescales according to which the Scottish Government must communicate with the Scottish Fiscal Commission around the budget. The SFC will provide the Scottish Government with copies of their forecasting models before publication of the budget to allow for further policy development in advance of the budget. The Scottish Government then shares near-final policy measures for inclusion in forecasts (the protocol says 18 days before the budget) and 10-15 before the budget the SFC produces forecasts incorporating Scottish Government policy. The SFC does not incorporate any policy measures notified to it less than 10 days before the budget.The SFC report is laid in Parliament and published on the SFC’s website after the Cabinet Secretary has presented the Budget document to Parliament.9
Block grant adjustment for 2017-18
The initial baseline adjustment is the OBR's estimate of Scottish NSND income tax in 2016-17 (produced in November 2016) - £11,525 million.1 This will be reconciled against outturn data once this is available2. In its latest forecast (November 2017), the OBR estimated 2016-17 revenues to be £11,520 million.
In Draft Budget 2017-18, the Scottish Government proposed to leave income tax rates the same as rUK, but to set the higher rate threshold at £43,430 (compared to £45,000 in rUK) for 2017-18. It estimated NSND income tax revenues would be £11,829 million.2 The Scottish Parliament agreed on 21 February 2017 to freeze the higher rate threshold in cash terms at £43,000 for 2017-18 and estimated this would raise £11,857m (£28 million more). This is the amount available to the Scottish Government to draw down from HM Treasury throughout 2017-18. The reconciliation process against the final outturn figure will be in 2019, to determine the adjustment to the block grant for 2020-21.4
Table 12 shows the BGA for 2017-18.
| 2017-18 Revenue | Difference with BGA (IPC) | |
|---|---|---|
| BGA (IPC method) (Dec. 2016) | 11,750 | |
| BGA (CM) (Dec. 2016) | 11,790 | |
| Scottish Government forecast (HRT at £43,430) (Dec. 2016) | 11,829 | 79 |
| Scottish Government forecast (HRT at £43,000) (Feb. 2017) | 11,857 | 107 |
| OBR (HRT at £43,000) (Nov. 2017) | 11,932 | 182 |
How much revenue could alternative proposals raise?
The baseline
The Scottish Government set out estimates of the revenue implications of various income tax proposals in its discussion paper on income tax.1 The revenue estimates set out in the Scottish Government discussion paper assumed a personal allowance of £11,850 for 2018-19, which is in line with the level announced in the UK Budget on 22 November 2017.
Changes in the personal allowance have a significant impact on tax revenues. Increasing the personal allowance from £11,500 to £11,850 in 2018-19, in the absence of any other changes, reduces tax revenues in Scotland by an estimated £170m. This estimate is based on SPICe modelling using Euromod (see Annex 2 for further details). The Scottish Government does not have any powers in respect of the personal allowance, which is set by the UK Government for the whole of the UK. The Scottish Government does have the option of introducing an additional tax band with a zero rate which would have similar effects to increasing the personal allowance. The effect of introducing an additional tax band with a zero rate would not be exactly the same as an increase in the personal allowance as the personal allowance is tapered for those earning in excess of £100,000, whereas a new tax band with a zero rate would be applicable to all taxpayers regardless of the level of their earnings
The Scottish Government discussion paper assumed a higher rate threshold (HRT) of £44,290, reflecting the Scottish Government's commitment to increase the HRT in line with inflation. This would represent a 3% increase on the 2017-18 HRT of £43,000 and is in line with the October 2017 consumer prices index (CPI).2The OBR adopts the same inflation assumption in its November 2017 Devolved Taxes Forecast but rounds the CPI estimate to 11 decimal points, resulting in an assumed HRT of £44,273 in Scotland in 2018-19. The OBR HRT has been used in the modelling in this briefing in order to be consistent with the OBR's income tax forecasts which will incorporate this assumed HRT.
The revenue estimates set out in this briefing compare the various options with the baseline position set out in Table 13.
| Personal allowance (£) | Higher rate threshold (£) | Additional rate threshold (£) | Basic rate (%) | Higher rate (%) | Additional rate (%) | |
|---|---|---|---|---|---|---|
| Baseline | 11,850 | 44,273 | 150,000 | 20 | 40 | 45 |
Modelling revenues
SPICe uses a microsimulation model known as Euromod to estimate income tax revenues. This is not exactly the same as the model used by the Scottish Government, so it would not be expected to produce identical results, although the broad magnitude of estimates will be similar. Some of the differences are outlined in Annex 2, which also explains more about the approach to modelling. An important point to note is that the SPICe estimates presented in this briefing do not take account of behavioural effects. That is, they are not adjusted for any changes in behaviour that might result from a change in income tax policy.
Income tax revenue estimates
The estimated revenues from a range of possible policy measures are set out in Table 14. In all cases, values relate to non-savings, non dividend (NSND) income tax revenues in Scotland. All calculations are relative to the baseline scenario outlined in Table 14.
| Policy measure | Estimated impact on income tax revenues, £m |
|---|---|
| Increase basic rate by 1p | 380 |
| Increase higher rate by 1p | 100 |
| Increase additional rate by 1p | 10 |
| Increase all rates by 1p | 490 |
| Introduce new zero rate band of £1,000 above personal allowance | -470 |
| Decrease HRT by £1,000 | 80 |
| 11 bands (see Annex 4 for rates and thresholds) | -250 |
See Annex 3 for the impact on household income tax for selected scenarios by income decile.
Note the margin of error in Euromod for the additional rate is very high and figures should be interpreted with caution, particularly at the additional rate level. The Scottish Government forecast that raising the additional rate in 2018-19 by 1p would lead to a £30 million increase in revenues for instance.1 This is using the SPI while Euromod uses the Family Resource Survey which has a very small sample of additional rate taxpayers.
Behavioural responses to tax changes
The estimates presented in Table 14 do not take account of behavioural responses to changes in tax policy. As discussed earlier in this briefing, in response to a change in tax rates or bands, individuals might change the number of hours they work, relocate to a different tax jurisdiction or (if they are able) alter the way in which they receive income (for example, from earnings to dividends). These types of behavioural responses are generally understood to be potentially greater for high earners, who have a higher incentive and/or are more able to adjust their behaviour in response to changes in tax policy. However, as the Scottish Government notes in its discussion paper on income tax, "the extent of any behavioural response is uncertain".1
While noting the uncertainties surrounding estimates of behavioural responses, the Scottish Government presents some estimates of behavioural responses in its discussion paper. Their estimates reflect the fact that behavioural responses are anticipated to be greater for higher earners. The Scottish Government note that for those earning more than £250,000, it uses a TIE range of 0.35-0.75, while for those earning up to £150,000 it uses the same TIE, but does not give details of the values it has used.
In comparison, for Draft Budget 2017-18 the Scottish Government applied the TIEs in Table 15 to estimate the behavioural response due to the higher rate threshold being different in Scotland and rUK. These TIEs were applied where a taxpayer sees a change in the proportion of each additional pound earned received by the individual after tax, known as the marginal tax rate. 2 The Scottish Government stated "lower TIEs were applied to calculate this aspect of the behavioural response"2 but did not specify which TIEs it used for this.
| Basic | Higher | Additional | |
|---|---|---|---|
| Low | 0.015 | 0.1 | 0.35 |
| High | 0.15 | 0.1 | 0.75 |
Table 16 shows the anticipated impact of behavioural changes on some of the scenarios presented in the Scottish Government's paper The Role of Income Tax in Scotland's Budget.1
| Policy measure | Estimated impact of behavioural response on additional income tax revenues |
|---|---|
| Increase basic rate by 1p | -3% |
| Increase higher rate by 1p | -20% |
| Increase additional rate by 1p | Between -60% and -110% |
This table highlights the potentially significant impact of behavioural responses, particularly where changes to the additional rate are concerned. Indeed, the Scottish Government estimates highlight that an increase in the additional rate is considered to have the potential to result in a reduction in income tax revenues as individuals alter their behaviour in response to the tax change. In its income tax discussion paper, the Scottish Government notes that: "the Scottish Government’s assessment of behavioural responses continues to be informed by the advice by the Council of Economic Advisers on the revenue risks for raising the [additional rate] to 50p. Further advice is expected ahead of the Draft Budget." They also note that the Scottish Fiscal Commission might adopt different assumptions in relation to TIEs.1
There is considerable uncertainty over the scale of potential behavioural responses and so estimates should be treated with caution. If Scotland adopts a different tax policy from the rest of the UK, this in itself will help to improve the evidence base and, in turn, the quality of behavioural response estimates.
Modelling behavioural responses not only requires assumptions to be made about TIEs, but also relies on detailed data on taxable incomes for taxpayers in Scotland. This information is not in the public domain, making it difficult to effectively scrutinise the behavioural response estimates produced by the Scottish Government, or to produce alternative estimates.
Further sources of information
HMRC income tables:
Table 2.11 Total UK (no regional breakdown) of number of individual income taxpayers from 1990-91 to 2017-18, including breakdown by marginal rate, male/female, non-pensioners/pensioners. Last updated 31 May 2017.
Table 2.22 Regional breakdown (no UK total) of number of individual income taxpayers from 1990-91 to 2017-18, including breakdown by marginal rate, total/male/female, non-pensioners/pensioners. Last updated 31 May 2017.
Table 3.113 Regional breakdown (including UK total) of different types of income (self-employment; employment; pension; property, interest, dividend and other; total) and total income tax, total/male/female, 2014-15, for different income brackets (UK total provides further breakdowns for incomes above £200,000, up to £1,000,000+; while Scotland provides only £200,000 + at that level)
Table 3.144 Regional and unitary authority breakdown (no UK total) of the total number of individuals, mean and median incomes of different types of income (self-employment; employment; pension; property, interest, dividend and other; total), and number of individuals, mean and median total income tax paid
HMRC do not publish total income tax paid by taxpayers broken down by marginal rate for Scotland - only for different income brackets.
HMRC analysis:
Personal incomes statistics: 2014 to 2015: introduction, commentary and tables 3.1 to 3.11 (revised).5. Revised 19 April 2017. Only Table 3.11 has figures for Scotland (see above).
Annex 1: Taxable and non-taxable benefits
The following benefits are taxable:1
State Pension
Jobseeker’s Allowance
Carer’s Allowance
Employment and Support Allowance (contribution based)
Incapacity Benefit (from the 29th week the recipient gets it)
Bereavement Allowance
pensions paid by the Industrial Death Benefit scheme
Widowed Parent’s Allowance
Widow’s pension
The most common non-taxable state benefits are:1
Housing Benefit
Employment and Support Allowance (income related)
Income Support - though you may have to pay tax on Income Support if the recipient is involved in a strike
Working Tax Credit
Child Tax Credit
Disability Living Allowance
Child Benefit (depending on the recipient's income, they may be charged income tax)
Personal Independence Payment (PIP)
Guardian’s Allowance
Attendance Allowance
Pension Credit
Winter Fuel Payments and Christmas Bonus
free TV licence for over-75s
lump-sum bereavement payments
Maternity Allowance
Industrial Injuries Benefit
Severe Disablement Allowance
Universal Credit
War Widow’s Pension
Annex 2: Case study of behavioural responses: Switzerland
Case study: Switzerland
Switzerland differs from the UK namely in its much higher levels of public consultation on a cantonal level and higher public expectations of government services and infrastructure. This may cause Swiss taxpayers to place more importance on where their tax goes than in the UK and could lead to different behavioural responses to changes in income tax.
Switzerland has the highest rate of annual wealth taxation in the developed world. Swiss cantons are largely autonomous regarding the base and rates of income tax. It. While the wealth tax base is defined at the federal level, tax rates vary considerably across locations and over time. Large disparities exist on a small geographical scale between other income tax rates also (e/g/ on earnings) despite recent attempts at harmonisation, particularly for high income earners. For example, marginal rates at an annual income of 500,000 Swiss Francs ranged from about 21%to more than 46% in cantons less than 200km apart in 2004.1There is some evidence that those with high incomes choose their place of residence depending on their income tax liability.2 Another study found similar results although it did not control for the fact that rich households may prefer to live near other rich households.3
A third study found no relation between migration and tax burden.1 This is supported anecdotally by a survey cited in the study which asked why people had migrated - no respondent cited tax as the prime motivation. However, there was no major overhaul in the tax system during the study period.
Recently, Brulhart et al. (2016) found that 2013 changes to wealth tax caused strong behavioural responses in the short-run and less so in the medium-term. This led the authors to state that current rates are well below the revenue maximizing rate. They found that taxpayers bunch below the tax threshold and that this is due to changes in reported wealth, not by mobility.5
Annex 3: SPICe approach to modelling income tax revenues
The SPICe estimates of non-savings, non-dividend (NSND) income tax revenues are based on analysis using Euromod, a tax-benefit microsimulation model which is maintained, developed and managed by the Institute for Social and Economic Research (ISER) at the University of Essex. This model allows users to model the impact of changes in taxes or benefits on individuals and households in Scotland. All the analysis is static in nature i.e. it does not take into account any behavioural responses that might occur following a change in taxes or benefits.
Euromod uses a slightly modified version of the Family Resource Survey (FRS) from 2014-15. This is an annual UK-wide household survey carried out by the ONS that collects information on the income and circumstances of private households in Great Britain. The model updates monetary variables in line with OBR forecasts to March 2017. However it does not make any other adjustments. Thus the distribution of characteristics (such as employment status and demographic variables) as well as the distribution of each income source that is not simulated by Euromod remains as they were in 2014-15. See this link for further details:
https://www.euromod.ac.uk/sites/default/files/country-reports/year7/Y7_CR_UK_Final.pdf
The tax and benefit rules in Euromod are for 2017-18. However, for the 2018-19 scenarios modelled in this briefing, we have adjusted the personal allowance and higher rate threshold to reflect anticipated policy parameters for 2018-19.
Euromod simulations have been used to estimate the percentage change in tax receipts that would occur under each modelled scenario. These estimates have then been applied to OBR tax revenue forecasts to provide estimates of the monetary impact of the proposals. This is in order to adjust for the fact that Euromod is known to underestimate total taxable income, especially for higher earners. The OBR estimates that Scottish non-savings non-dividend (NSND) income tax receipts in 2018-19 will be £12,153m, assuming inflationary uprating of the HRT and no changes to the Additional Rate threshold.1
The estimates produced by Euromod will differ from those produced by other microsimulation models e.g. those used by the Scottish Government, the OBR, the IFS and the Fraser of Allander Institute. Although all the models will be built on similar principles, the underpinning data and uprating assumptions will differ. For example, some models use the Survey of Personal Incomes (SPI) rather than the Family Resources Survey (FRS) as the source of income data. There may also be differences in assumptions made, for example, about wage growth and labour market growth.
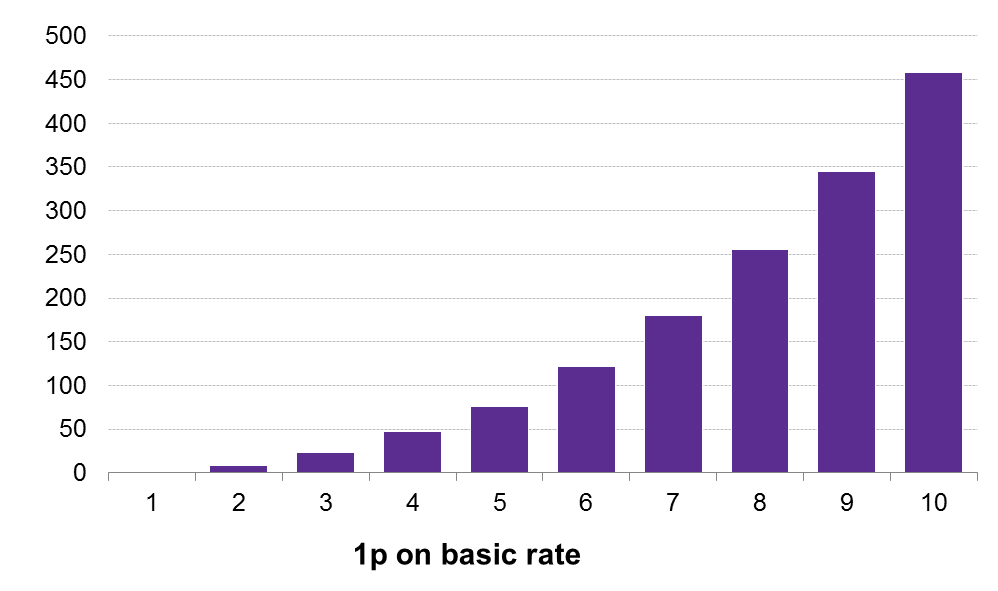
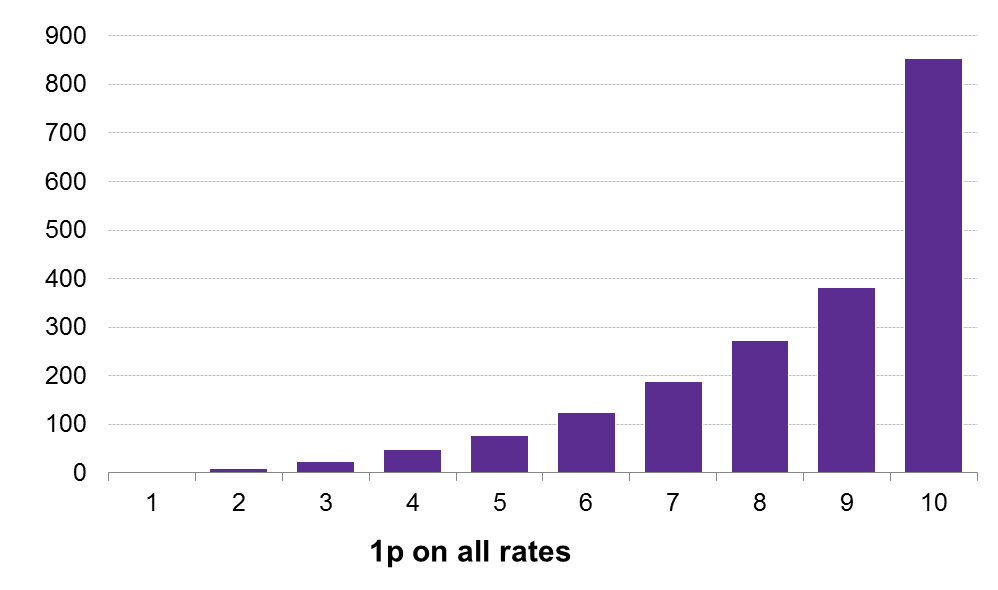
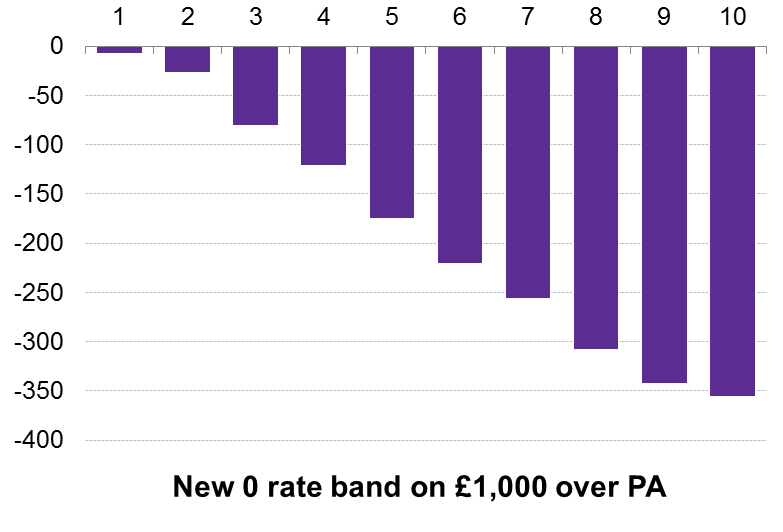
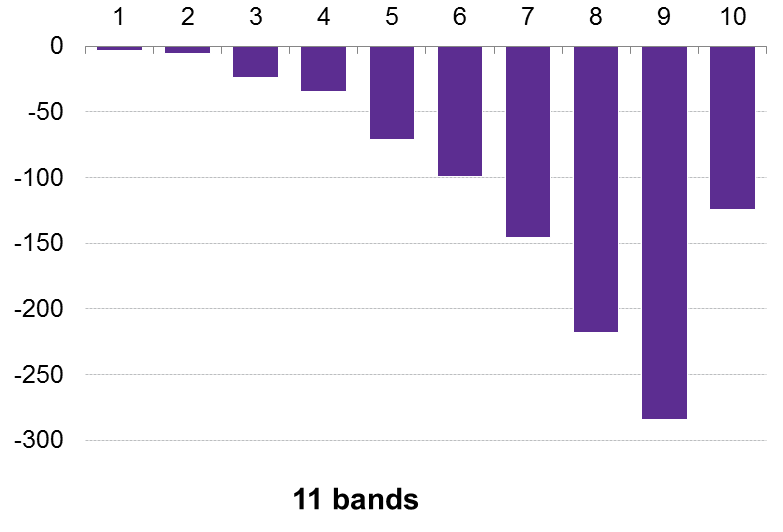
Annex 4: Impact of selected scenarios on average household income tax by income decile
The following figures show the impact per year in pounds on the average household income tax by income decile (using equivalised household disposable income) on 4 selected scenarios described in Table 14 copied in below (Table 17) for convenience.
| Policy measure | Estimated impact on income tax revenues, £m |
|---|---|
| Increase basic rate by 1p | 380 |
| Increase higher rate by 1p | 100 |
| Increase additional rate by 1p | 10 |
| Increase all rates by 1p | 490 |
| Introduce new zero rate band of £1,000 above personal allowance | -470 |
| Decrease HRT by £1,000 | 80 |
| 11 bands | -250 |
The 11 band scenario is shown below:
| Rate (%) | Threshold |
|---|---|
| 15 | 12,000 |
| 18 | 20,000 |
| 20 | 30,000 |
| 23 | 40,000 |
| 25 | 50,000 |
| 30 | 60,000 |
| 35 | 70,000 |
| 40 | 80,000 |
| 45 | 90,000 |
| 48 | 150,000 |
| 50 | n/a |
Sources
UK Government. (2016). Scottish Taxpayer Technical Guidance. Retrieved from <a href="https://www.gov.uk/hmrc-internal-manuals/scottish-taxpayer-technical-guidance" target="_blank">https://www.gov.uk/hmrc-internal-manuals/scottish-taxpayer-technical-guidance</a> [accessed 22 November 2017]
UK Government. HM Revenue & Customs. (2017). Annual Report and Accounts 2016-17. Retrieved from <a href="https://www.gov.uk/government/uploads/system/uploads/attachment_data/file/628377/HMRC_Annual_Report_and_Accounts_2016-17__print_.pdf" target="_blank">https://www.gov.uk/government/uploads/system/uploads/attachment_data/file/628377/HMRC_Annual_Report_and_Accounts_2016-17__print_.pdf</a> [accessed 22 November 2017]
Office for National Statistics. (2017). CPI: Consumer Prices Index (% change). Retrieved from <a href="https://www.ons.gov.uk/economy/inflationandpriceindices/timeseries/d7g7/mm23" target="_blank">https://www.ons.gov.uk/economy/inflationandpriceindices/timeseries/d7g7/mm23</a> [accessed 5 December 2017]
Scottish Government. (2016). Scotland's Draft BUdget 2017-18. Retrieved from <a href="http://www.gov.scot/Resource/0051/00511808.pdf" target="_blank">http://www.gov.scot/Resource/0051/00511808.pdf</a>
Scottish Government. (2017). Protection for tax payers. Retrieved from <a href="https://news.gov.scot/news/protection-for-tax-payers" target="_blank">https://news.gov.scot/news/protection-for-tax-payers</a> [accessed 26 November 2017]
HM Revenue and Customs. (2017). Table 2.2 Number of income taxpayers, by country. Retrieved from <a href="https://www.gov.uk/government/statistics/number-of-individual-income-taxpayers-by-marginal-rate-gender-and-age-by-country" target="_blank">https://www.gov.uk/government/statistics/number-of-individual-income-taxpayers-by-marginal-rate-gender-and-age-by-country</a> [accessed 26 November 2017]
UK Government. (2017). Autumn Budget 2017. Retrieved from <a href="https://www.gov.uk/government/publications/autumn-budget-2017-documents" target="_blank">https://www.gov.uk/government/publications/autumn-budget-2017-documents</a> [accessed 27 November 2017]
HM Revenue and Customs. (2016). Savings and Investment Manual. Retrieved from <a href="https://www.gov.uk/hmrc-internal-manuals/savings-and-investment-manual/saim1090" target="_blank">https://www.gov.uk/hmrc-internal-manuals/savings-and-investment-manual/saim1090</a> [accessed 26 November 2017]
Hm Revenue and Customs. (2017). UK Income Tax Liabilities Statistics 2014-15 Survey of Personal Incomes, with projections to 2017-18 Includes Tables 2.1 to 2.7. Retrieved from <a href="https://www.gov.uk/government/uploads/system/uploads/attachment_data/file/616452/Income_Tax_Liabilities_Statistics_May_2017.pdf" target="_blank">https://www.gov.uk/government/uploads/system/uploads/attachment_data/file/616452/Income_Tax_Liabilities_Statistics_May_2017.pdf</a> [accessed 28 November 2017]
Office for National Statistics. (2017). Population Estimates for UK, England and Wales, Scotland and Northern Ireland: mid-2016. Retrieved from <a href="https://www.ons.gov.uk/peoplepopulationandcommunity/populationandmigration/populationestimates/bulletins/annualmidyearpopulationestimates/mid2016" target="_blank">https://www.ons.gov.uk/peoplepopulationandcommunity/populationandmigration/populationestimates/bulletins/annualmidyearpopulationestimates/mid2016</a> [accessed 28 November 2017]
Office for National Statistics. (2017, November 14). UK consumer price inflation: October 2017. Retrieved from <a href="https://www.ons.gov.uk/economy/inflationandpriceindices/bulletins/consumerpriceinflation/october2017" target="_blank">https://www.ons.gov.uk/economy/inflationandpriceindices/bulletins/consumerpriceinflation/october2017</a>
HM Revenue and Customs. (2017). Income and tax, by gender, region and country. Retrieved from <a href="https://www.gov.uk/government/statistics/income-and-tax-by-gender-region-and-country-2010-to-2011" target="_blank">https://www.gov.uk/government/statistics/income-and-tax-by-gender-region-and-country-2010-to-2011</a> [accessed 29 November 2017]
HM Revenue and Customs. (2017). Income and tax by borough and district or unitary authority. Retrieved from <a href="https://www.gov.uk/government/statistics/income-and-tax-by-borough-and-district-or-unitary-authority-2010-to-2011" target="_blank">https://www.gov.uk/government/statistics/income-and-tax-by-borough-and-district-or-unitary-authority-2010-to-2011</a> [accessed 29 November 2017]
Office for Budget Responsibility. (2017). Economic and fiscal outlook. Retrieved from <a href="http://cdn.budgetresponsibility.org.uk/Nov2017EFOwebversion-2.pdf" target="_blank">http://cdn.budgetresponsibility.org.uk/Nov2017EFOwebversion-2.pdf</a> [accessed 22 November 2017]
Office for Budget Reponsibility. (2017). Scottish tax forecasts. Retrieved from <a href="http://budgetresponsibility.org.uk/topics/scotland-wales-and-northern-ireland/scottish-tax-forecasts/" target="_blank">http://budgetresponsibility.org.uk/topics/scotland-wales-and-northern-ireland/scottish-tax-forecasts/</a> [accessed 5 December 2017]
Office for Budget Responsibility. (2017). Economic and fiscal outlook – November 2017. Retrieved from <a href="http://budgetresponsibility.org.uk/efo/economic-fiscal-outlook-november-2017/" target="_blank">http://budgetresponsibility.org.uk/efo/economic-fiscal-outlook-november-2017/</a> [accessed 5 December 2017]
National Audit Office. (2015). The administration of the Scottish Rate of Income Tax 2014-15. Retrieved from <a href="https://www.nao.org.uk/wp-content/uploads/2015/11/The-administration-of-the-Scottish-Rate-of-Income-Tax-2014-15.pdf" target="_blank">https://www.nao.org.uk/wp-content/uploads/2015/11/The-administration-of-the-Scottish-Rate-of-Income-Tax-2014-15.pdf</a> [accessed 22 November 2017]
National Audit Office. (2016). The administration of the Scottish Rate of Income Tax 2015-16. Retrieved from <a href="https://www.nao.org.uk/wp-content/uploads/2016/12/The-administration-of-the-Scottish-Rate-of-Income-Tax-2015-16.pdf" target="_blank">https://www.nao.org.uk/wp-content/uploads/2016/12/The-administration-of-the-Scottish-Rate-of-Income-Tax-2015-16.pdf</a> [accessed 22 November 2017]
National Audit Office. (2017). The administration of the Scottish Rate of Income Tax 2016-17. Retrieved from <a href="https://www.nao.org.uk/report/scottish-rate-of-income-tax-2016-17/" target="_blank">https://www.nao.org.uk/report/scottish-rate-of-income-tax-2016-17/</a> [accessed 5 December 2017]
Scottish Government. (2017). Personal correspondence.
UK Government. (2017). Capital Gains Tax. Retrieved from <a href="https://www.gov.uk/capital-gains-tax/allowances" target="_blank">https://www.gov.uk/capital-gains-tax/allowances</a>
HM Revenue and Customs. (2017). Annual Report and Accounts 2016-17. Retrieved from <a href="https://www.gov.uk/government/uploads/system/uploads/attachment_data/file/635587/HMRC_Annual_Report_and_Accounts_2016-17_web_.pdf" target="_blank">https://www.gov.uk/government/uploads/system/uploads/attachment_data/file/635587/HMRC_Annual_Report_and_Accounts_2016-17_web_.pdf</a> [accessed 26 November 2017]
UK Exchequer. (2012). The Exchequer effect of the 50 per cent additional rate of income tax. Retrieved from <a href="http://webarchive.nationalarchives.gov.uk/20130127161217/http://www.hmrc.gov.uk/budget2012/excheq-income-tax-2042.pdf" target="_blank">http://webarchive.nationalarchives.gov.uk/20130127161217/http://www.hmrc.gov.uk/budget2012/excheq-income-tax-2042.pdf</a> [accessed 26 November 2017]
Institute for Fiscal Studies. (2012). The IFS Green Budget February 2012. Retrieved from <a href="https://www.ifs.org.uk/budgets/gb2012/gb2012.pdf" target="_blank">https://www.ifs.org.uk/budgets/gb2012/gb2012.pdf</a> [accessed 26 November 2017]
University of Nebraska - Lincoln. Economics Department. (2010). The Elasticity of Taxable Income during the 1990s: New Estimates and Sensitivity Analyses. Retrieved from <a href="http://digitalcommons.unl.edu/cgi/viewcontent.cgi?article=1069&context=econfacpub" target="_blank">http://digitalcommons.unl.edu/cgi/viewcontent.cgi?article=1069&context=econfacpub</a> [accessed 2017 November 2017]
Berthier, A. (2014). The Scottish rate of income tax and additional rate taxpayers. Retrieved from <a href="http://www.parliament.scot/ResearchBriefingsAndFactsheets/S4/SB_14-14.pdf" target="_blank">http://www.parliament.scot/ResearchBriefingsAndFactsheets/S4/SB_14-14.pdf</a> [accessed 26 November 2017]
Tax Analysis Division Congressional Budget Office Washington, D.C. (2005). A Sensitivity Analysis of the Elasticity of Taxable Income. Working Paper Series Congressional Budget Office Washington, D.C.. Retrieved from <a href="http://www.cbo.gov/sites/default/files/cbofiles/ftpdocs/60xx/doc6077/wp-2005-01.pdf" target="_blank">http://www.cbo.gov/sites/default/files/cbofiles/ftpdocs/60xx/doc6077/wp-2005-01.pdf</a> [accessed 2017 November 2017]
UK Parliament. House of Commons Library. (2015). Income tax: the additional 50p rate. Retrieved from <a href="http://researchbriefings.parliament.uk/ResearchBriefing/Summary/SN00249" target="_blank">http://researchbriefings.parliament.uk/ResearchBriefing/Summary/SN00249</a> [accessed 26 November 2017]
UK Government. (2016). The agreement between the Scottish government and the United Kingdom government on the Scottish government’s fiscal framework. Retrieved from <a href="https://www.gov.uk/government/publications/the-agreement-between-the-scottish-government-and-the-united-kingdom-government-on-the-scottish-governments-fiscal-framework" target="_blank">https://www.gov.uk/government/publications/the-agreement-between-the-scottish-government-and-the-united-kingdom-government-on-the-scottish-governments-fiscal-framework</a> [accessed 22 November 2017]
HM Treasury. (2009). Budget 2009. Building Britain's future. Retrieved from <a href="http://webarchive.nationalarchives.gov.uk/+/http://www.hm-treasury.gov.uk/d/bud09_completereport_2520.pdf" target="_blank">http://webarchive.nationalarchives.gov.uk/+/http://www.hm-treasury.gov.uk/d/bud09_completereport_2520.pdf</a> [accessed 26 November 2017]
UK Parliament. House of Commons. (2012). Oral Answers to Questions. Cabinet Office. Wednesday 21 March 2012. Retrieved from <a href="https://publications.parliament.uk/pa/cm201212/cmhansrd/cm120321/debtext/120321-0001.htm" target="_blank">https://publications.parliament.uk/pa/cm201212/cmhansrd/cm120321/debtext/120321-0001.htm</a> [accessed 26 November 2017]
Institute for Fiscal Studies. (2014). 50p tax – strolling across the summit of the Laffer curve?. Retrieved from <a href="https://www.ifs.org.uk/publications/7066" target="_blank">https://www.ifs.org.uk/publications/7066</a> [accessed 26 November 2017]
UK Government. (2017). Table 2.1 Number of individual income taxpayers. Retrieved from <a href="https://www.gov.uk/government/statistics/number-of-individual-income-taxpayers-by-marginal-rate-gender-and-age" target="_blank">https://www.gov.uk/government/statistics/number-of-individual-income-taxpayers-by-marginal-rate-gender-and-age</a> [accessed 26 November 2017]
Scottish Government. (2016). The impact of an increase in the additional rate of income tax from 45p to 50p Scotland. Retrieved from <a href="http://www.gov.scot/Resource/0049/00497818.pdf" target="_blank">http://www.gov.scot/Resource/0049/00497818.pdf</a> [accessed 26 November 2017]
Scottish Government. (2017). Scottish Government Fifth Annual Report on the Implementation and Operation of Part 3 (Financial Provisions) of the Scotland Act 2012: Report on the Implementation of the Scotland Act 2016. Retrieved from <a href="http://www.gov.scot/Resource/0051/00516889.pdf" target="_blank">http://www.gov.scot/Resource/0051/00516889.pdf</a> [accessed 23 November 2017]
Office for Budget Responsibility. (n.d.) Devolved taxes forecast. Retrieved from <a href="http://cdn.budgetresponsibility.org.uk/DevolvedAutumn2017.pdf" target="_blank">http://cdn.budgetresponsibility.org.uk/DevolvedAutumn2017.pdf</a> [accessed 22 November 2017]
Eiser, D. (2017). Essentials of the Fiscal Framework. Retrieved from <a href="http://www.parliament.scot/S5_Finance/Essentials_of_the_Fiscal_Framework_David_Eiser.pdf" target="_blank">http://www.parliament.scot/S5_Finance/Essentials_of_the_Fiscal_Framework_David_Eiser.pdf</a> [accessed 22 November 2017]
Office for Budget Responsibility. (2012). Forecasting Scottish taxes. Retrieved from <a href="http://budgetresponsibility.org.uk/docs/dlm_uploads/Forecasting-Scottish-taxes.pdf" target="_blank">http://budgetresponsibility.org.uk/docs/dlm_uploads/Forecasting-Scottish-taxes.pdf</a> [accessed 5 December 2017]
Scottish Government. (2017). Scottish Budget - Draft Budget 2017-18. Devolved Taxes Forecast Methodology. Retrieved from <a href="http://www.gov.scot/Resource/0051/00511834.pdf" target="_blank">http://www.gov.scot/Resource/0051/00511834.pdf</a> [accessed 28 November 2017]
Scottish Fiscal Commission. (2017). Current Approach to Forecasting September 2017. Retrieved from <a href="http://www.fiscalcommission.scot/publications/occasional-papers/current-approach-to-forecasting-september-2017/" target="_blank">http://www.fiscalcommission.scot/publications/occasional-papers/current-approach-to-forecasting-september-2017/</a> [accessed 5 December 2017]
Scottish Fiscal Commission. (2017). Protocol for engagement between the Scottish Fiscal Commission and the Scottish Government. Retrieved from <a href="http://www.fiscalcommission.scot/media/1152/protocol-for-engagement-between-the-scottish-fiscal-commission-and-the-scottish-government.pdf" target="_blank">http://www.fiscalcommission.scot/media/1152/protocol-for-engagement-between-the-scottish-fiscal-commission-and-the-scottish-government.pdf</a> [accessed 5 December 2017]
Office for Budget Responsibility. (2016). Supplementary forecast information releas: Devolved tax forecasts. Retrieved from <a href="http://budgetresponsibility.org.uk/docs/dlm_uploads/Devolved-supplementary-release.pdf" target="_blank">http://budgetresponsibility.org.uk/docs/dlm_uploads/Devolved-supplementary-release.pdf</a> [accessed 22 November 2017]
Scottish Government. (2017, November). The Role of Income Tax in Scotland's Budget. Retrieved from <a href="http://www.gov.scot/Publications/2017/11/5307/downloads" target="_blank">http://www.gov.scot/Publications/2017/11/5307/downloads</a>
UK Government. (2017). Income Tax. Retrieved from <a href="https://www.gov.uk/income-tax/taxfree-and-taxable-state-benefits" target="_blank">https://www.gov.uk/income-tax/taxfree-and-taxable-state-benefits</a> [accessed 26 November 2017]
Liebig, T., & Sousa-Poza, A. (2006). The influence of taxes on migration: evidence from Switzerland. Cambridge Journal of Economics, 30(2), 235-252. doi: https://doi.org/10.1093/cje/bei057
Feld, L., & Kirchgässner, G. (2000). Income Tax Competition at the State and Local Level in Switzerland. CESifo Working Paper Series. Retrieved from <a href="http://www.cesifo-group.de/portal/page/portal/DocBase_Content/WP/WP-CESifo_Working_Papers/wp-cesifo-2000/wp-cesifo-2000-01/WP238.PDF" target="_blank">http://www.cesifo-group.de/portal/page/portal/DocBase_Content/WP/WP-CESifo_Working_Papers/wp-cesifo-2000/wp-cesifo-2000-01/WP238.PDF</a> [accessed 26 November 2017]
Schmidheiny, K. (2003). Income Segregation and Local Progressive Taxation: Empirical Evidence from Switzerland. Retrieved from <a href="http://citeseerx.ist.psu.edu/viewdoc/download;jsessionid=8A72770D933060543F4AAF02654B6AFF?doi=10.1.1.202.6693&rep=rep1&type=pdf" target="_blank">http://citeseerx.ist.psu.edu/viewdoc/download;jsessionid=8A72770D933060543F4AAF02654B6AFF?doi=10.1.1.202.6693&rep=rep1&type=pdf</a> [accessed 26 November 2017]
Brülhart, M., Gruber, J., Krapf, M., & Schmidheiny, K. (2016). Taxing Wealth: Evidence from Switzerland. Retrieved from <a href="http://www.nber.org/papers/w22376" target="_blank">http://www.nber.org/papers/w22376</a> [accessed 26 November 2017]