Local Government Finance: Draft Budget 2018-19 and provisional allocations to local authorities
This briefing focuses on allocations to local authorities with the Scottish Government's Draft Budget 2018-19. Two other briefings have been published by SPICe - one on the overall Draft Budget 2018-19 and one on the tax proposals of the Scottish Government.More detailed presentation of the budget figures can be found in our Draft Budget spreadsheets.
Executive summary
This briefing sets out a summary and analysis of the local government budget for 2018-19, and the provisional allocations to local authorities.
The last two fiscal years (2016-17 and 2017-18) have been characterised by reductions in the core grant to local authorities, together with a number of changes to the way in which the total amount of resources available to local authorities has been presented.
In response to the issues raised in during the 2017-18 budget process, and by the Budget Process Review Group, the Scottish Government has made a number of changes to the way in which the local government information is presented in the Budget document and the Local Government Finance Circular.
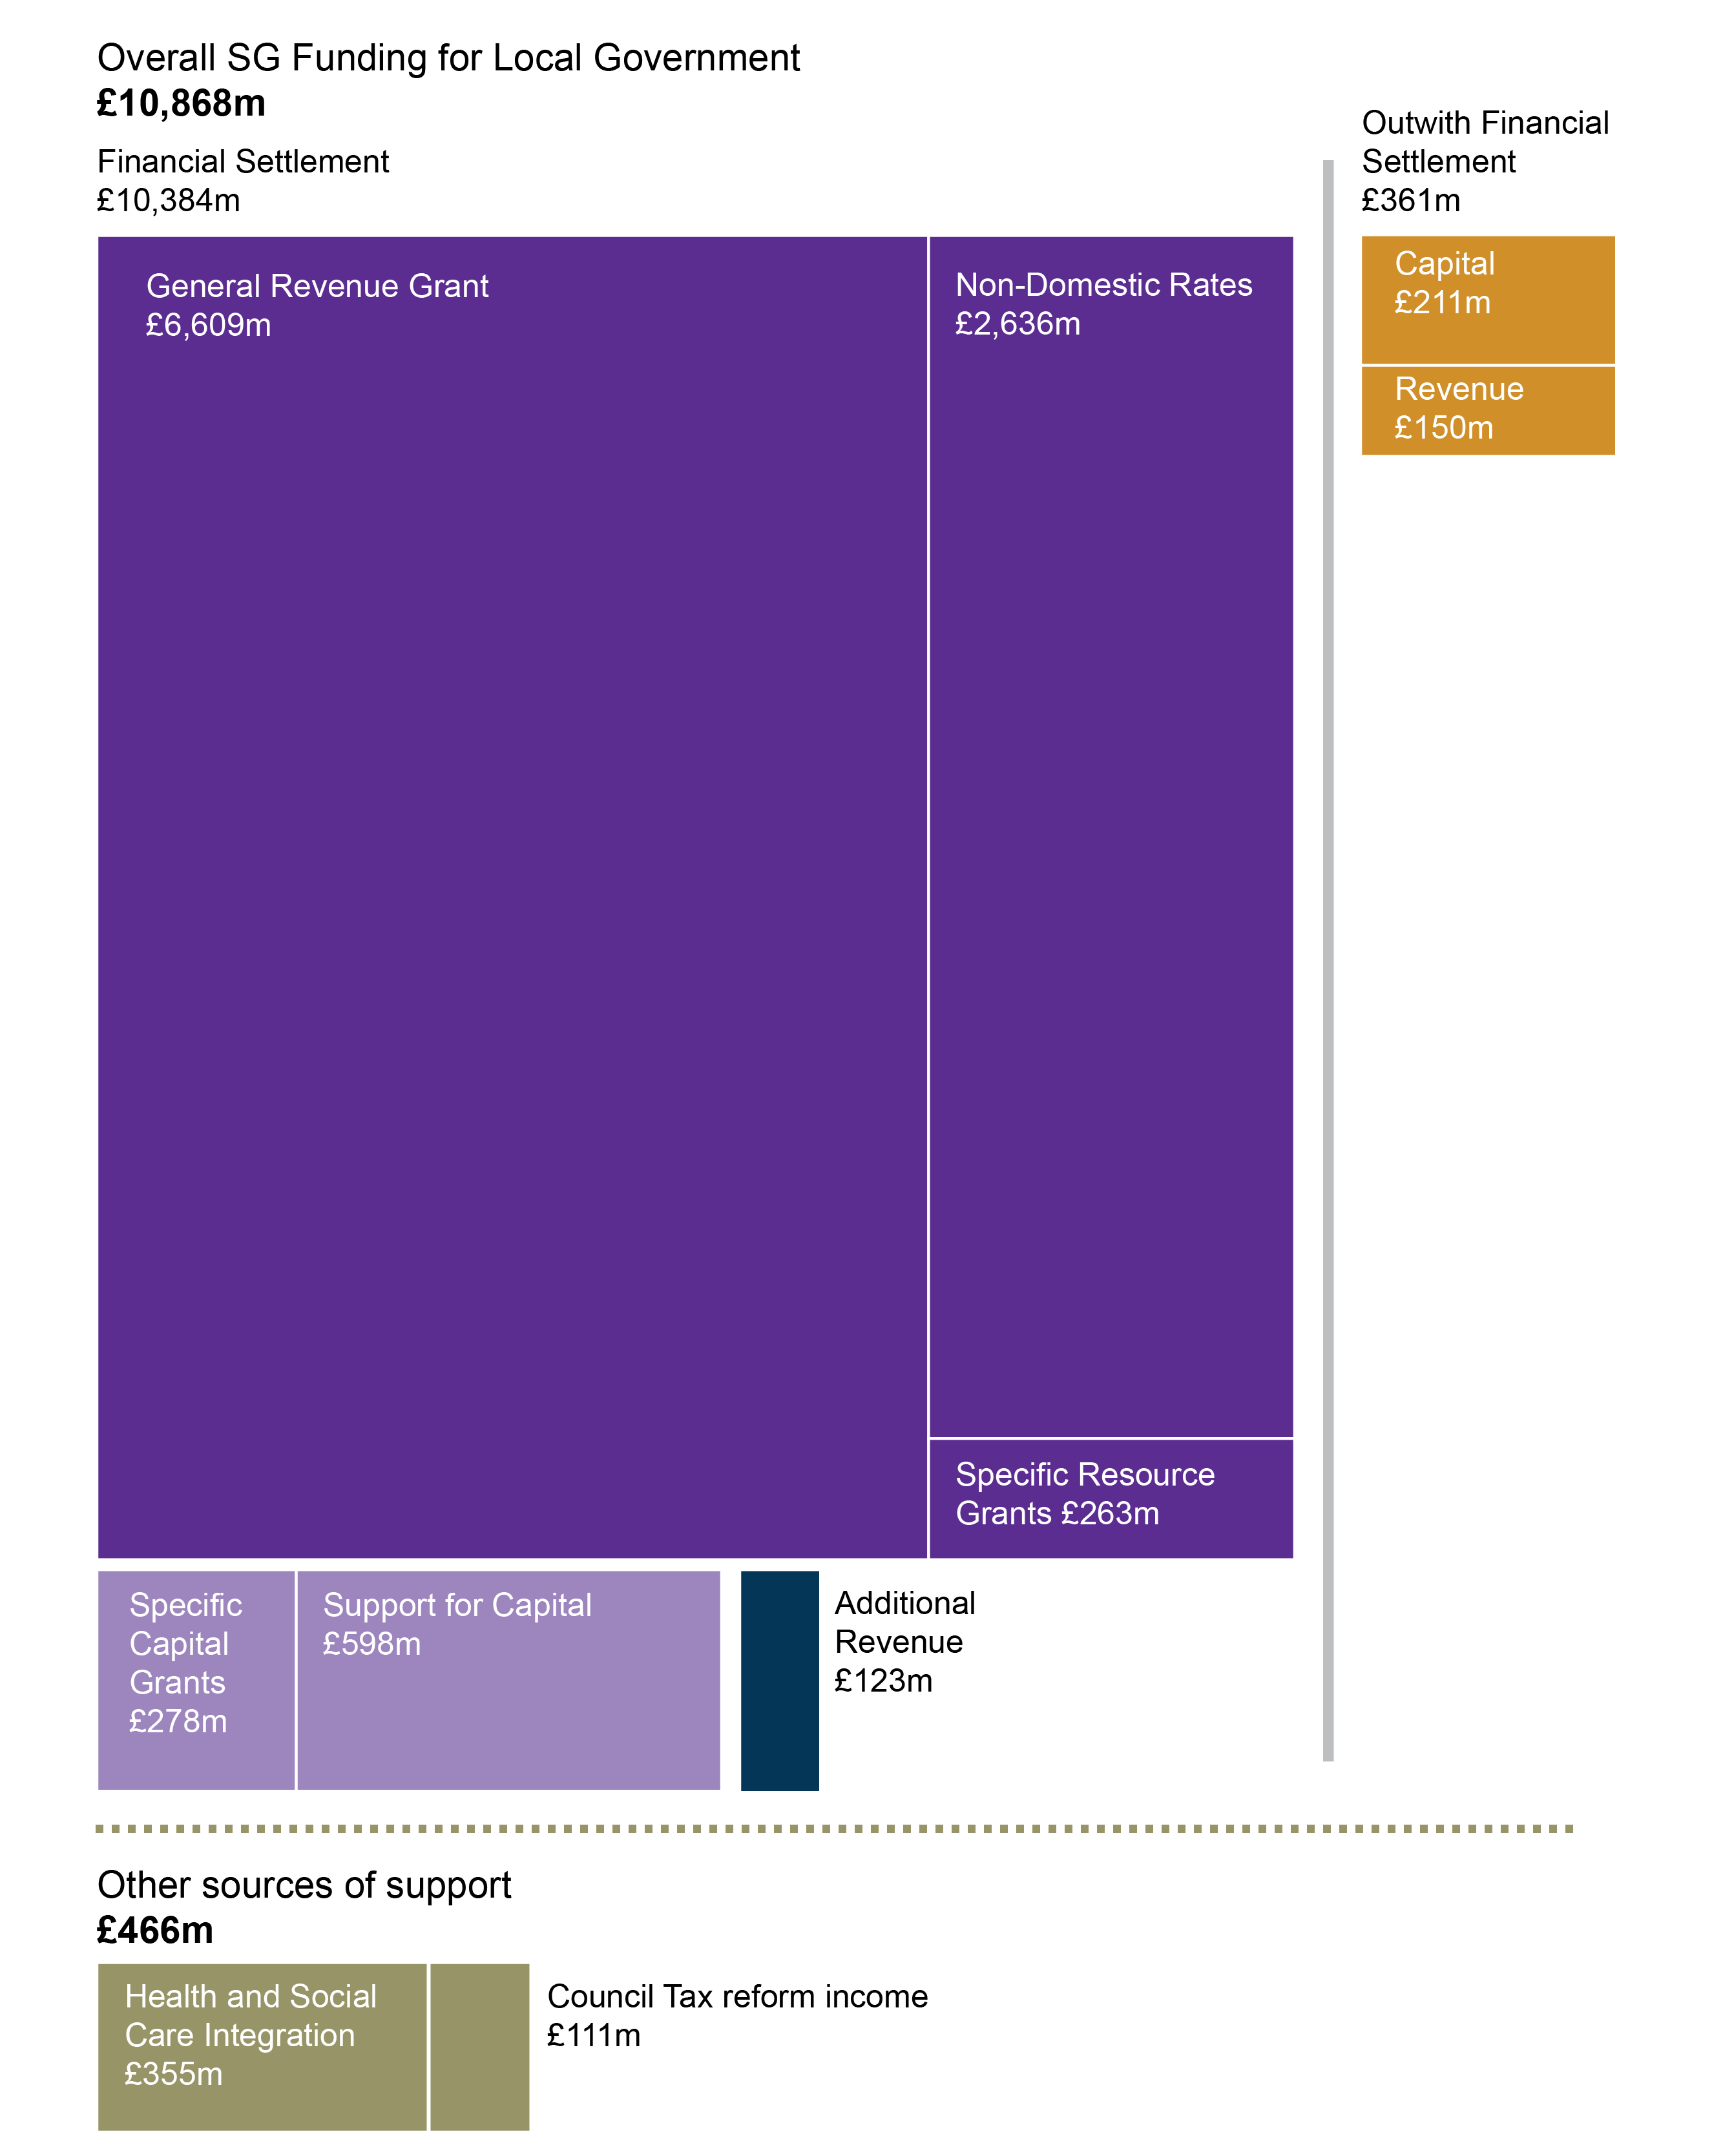
The total allocation to local government in the 2018-19 Draft Budget is £10,384.1m. This is mostly made up of General Revenue Grant (GRG) and Non-Domestic Rates Income (NDRI), with smaller amounts for General Capital Grant and Specific (or ring-fenced) Revenue and Capital grants.
Once Revenue funding in other portfolios is included (as set out in the Finance Circular), the "Total Core Local Government Settlement" is £10,507.1m.
And, if all funding outwith the local government finance settlement (but still from the Scottish Government to local authorities) is included, the total is £10,868.1m. Finally, if "other sources of support" are included the total rises to £11,334.1.
Key messages-
The Draft Budget numbers show General Revenue Grant plus Non Domestic Rates Income falling by 0.5% (-£49.1m) in cash terms, or 2% (-£183.7m) in real terms between 2017-18 and 2018-19.
When Specific Revenue Grants are taken into account, there is a small cash increase in Total Revenue funding for 2018-19 (+£3.2m). In real terms, this results in a reduction of 1.4% (-£135.2m).
Total Capital funding, by comparison, increases by 11.4% (£89.9m) in cash terms, or 9.8% (£77.1m) in real terms, although this increase is due to an increase in specific grants - general support for capital is decreasing in cash and real terms.
The numbers in the Local Government Finance Circular contain a number of additional Revenue funds to those in the Draft Budget. These changes mean that the headline numbers are slightly different to those in the Draft Budget. "Total Revenue" is shown as falling by 0.2% in cash terms (-£17.1m) and by 1.6% in real terms (-£157.3m). The differences are explained in both the Draft Budget and in the Total allocations section of this briefing.
Between 2010-11 and 2017-18, if the spend on police and fire services in 2010-11 to 2012-14 is adjusted out, the local government Revenue Budget fell at a steeper rate (-8.5%) than the Scottish Government Revenue Budget (-5.1%) (including Non-Domestic Rates Income on both sides).
Looking at the more comparable years between 2013-14 and 2017-18, the local government Revenue Budget fell by 6.9%, whereas the Scottish Government Revenue Budget fell by only 1.6% (again, including Non-Domestic Rates Income on both sides).
Policy commitments for local government in 2018-19 focus on Early Years education and childcare, teachers' pay for 2018-19, maintaining teacher numbers, the teachers' induction scheme, and Health and Social Care.
The ability to raise Council Tax by 3% has again been granted to local authorities for 2018-19. This could potentially raise an additional £77m for local authorities, if all 32 agree to raise Council Tax by the maximum 3%.
SPICe notes that pay is delegated to local authorities and so the Government's pay policy does not apply to council employees. However, SPICe has estimated that, if local authorities were to match the Scottish Government's pay policy, this would cost around £150m in 2018-19. As noted above, the funding available to local authorities for core services (GRG + NDRI) is due to fall by £49.1m in cash terms, and "total Revenue" funding is increasing by £3.2m. Therefore, councils may face challenges in matching this pay policy commitment.
When making comparisons on the provisional settlement for local authorities, on a "like for like" basis, Argyll and Bute Council faces a fall in Total Revenue Funding of 4% in 2018-19, compared to a Scottish average of -1.8%. Midlothian Council sees the smallest impact on Total Revenue Funding, of only -0.1%.
Comhairle nan Eilean Siar receives roughly 200% of the Scottish Government average for Total Revenue funding. Conversely, the City of Edinburgh receives 79% of the Scottish Government average for Total Revenue funding. These figures reflect the funding formula for local authorities as agreed by the Scottish Government and CoSLA, in which the Council Tax base of individual local authorities and the Special Islands Needs Allowance is taken into account.
Understanding the local government budget
Funding for local authorities in Scotland is drawn from a number of sources, but by far the greatest portion of funding comes from the settlement from the Scottish Government. In recent years this has been announced at the point of the Draft Budget, and can be updated in advance of the Budget Bill. In addition, further allocations to local authorities are made in-year.
Presenting the figures
As covered in previous SPICe briefings on the Scottish Government Draft Budget, the last two fiscal years (2016-171 and 2017-182) have been characterised by reductions in the core grant to local authorities, together with a number of changes to the way in which the total amount of resources available to local authorities has been presented.
Presentation of the headline figures for local government can be complicated by-
Whether 'Draft Budget' or 'Budget' figures for the previous year are used as the basis for comparisons with previous years.
Which number is used for the Scottish Government's direct grants to local government - either the "Total Local Government" line or the the sum of "General Resource Grant + Non-Domestic Rates Income".
Whether figures are presented in cash or real terms.
Whether figures for "Total Estimated Expenditure" are used, which also include income raised from Council Tax.
Whether "other sources of support" are included. In 2017-18 this included funding for Health and Social Care (also included in Health budget totals), and additional income expected from Council Tax reforms.
Taken together, different combinations of these issues can lead to huge variations in the headline £million and percentage change figures that are presented. This issue was discussed in detail during the 2017-18 parliamentary budget process. For 2018-19, the Government has made a number of changes to make presentation of the local government numbers clearer and easier to follow. This is discussed in the Transparency section of this briefing.
Transparency
Issues raised during the 2017-18 Draft Budget
The Local Government and Communities Committee, in its report to the Finance and Constitution Committee on the Scottish Government's Draft Budget 2017-181, expressed concerns about the transparency of budget documentation. The Committee said it-
found it difficult to undertake rigorous scrutiny of the Draft Budget actual figures, not only because of the shortened timetable this year but also the way in which the budget allocations are presented and information is contained both in the draft Budget and the Finance Circular
Scottish Parliament Local Government and Communities Committee. (2017, January 27). Report on the Scottish Government’s Draft Budget 2017-18. Retrieved from http://www.parliament.scot/S5_Local_Gov/Reports/LGCS052017R02.pdf [accessed 15 June 2017]
It called for the Scottish Government to set out proposals for how the figures detailed in the budget process could be more transparent, and concluded-
The Committee believes that greater transparency is required, and that the Draft Budget for local government, and the allocations to local authorities are very difficult to follow. It is essential in scrutiny terms that this Committee and the Parliament as a whole is clear on exactly how much money local authorities can be expected to receive and from what sources and with what conditions, if any, on their purpose.
Scottish Parliament Local Government and Communities Committee. (2017, January 27). Report on the Scottish Government’s Draft Budget 2017-18. Retrieved from http://www.parliament.scot/S5_Local_Gov/Reports/LGCS052017R02.pdf [accessed 15 June 2017]
The Scottish Government responded-
This proposal is accepted and although the publication of the Draft Budget and the local government finance settlement on the same day does not help, the Scottish Government will undertake to provide as clear as possible the necessary transparency. This could include full reconciliations between Draft Budget and Budget figures; Draft Budget to Draft Budget figures; and the changes between the Draft Budget figures and the total local government funding contained within the consultation Local Government Finance Circular. The breakdown of funding outwith the settlement can also be provided and consideration will be given to separating the date of the Draft Budget and the Local Government Finance Settlement.
Scottish Government. (2017, March 9). Scottish Government Response to the Local Government and Communities Committee's Report on the Draft Budget 2017-18. Retrieved from http://www.parliament.scot/S5_Local_Gov/Inquiries/20170309_DraftBudgetReportSGResponse.pdf [accessed 14 December 2017]
Similar concerns about the transparency of budget documents were raised in the Budget Process Review Group's Final Report5 in June 2017. The Group, at Recommendation 44, made various suggestions as to how budget document could be made more transparent. This included the suggestion that there be a consistent approach to financial presentation within the budget document, and a call for clarity regarding the relationship between budget allocations and available funding in different parts of the budget document. The Group stated that "spending allocations across all portfolios within the budget document must be reconciled with available funding".
Changes in the 2018-19 Draft Budget
In response to the issues raised in during the 2017-18 budget process, and by the Budget Process Review Group, the Scottish Government has made a number of changes to the way in which the local government information is presented in the Budget document and the Local Government Finance Circular.
In addition to Table 10.13, which sets out the level 3 breakdown of the local government budget, the document now contains additional tables. These tables enable readers to track funding from the Budget to the Local Government Finance Circular (Table 10.12) and to see the full picture of funding outside the local government finance settlement (Table 10.20). The figures involved are set out in our analysis of the Draft Budget.
The local government funding formula
The funding formula for local government is set out in the 'Green Book' for Grant Aided Expenditure1. The Scottish Government agrees with the Convention of Scottish Local Authorities (CoSLA) the Total Revenue funding that will be made available for the duration of the Spending Review, however in recent years the Draft Budget has been presented as a single-year budget. The total amount of Revenue, funding when added to an assumed amount of Council Tax income collected locally, must equal the Total Estimated Expenditure (TEE).
The key building blocks used to calculate each local authority’s share of the available funding are the service and sub-service Grant Aided Expenditure (GAE) assessments, which make up the bulk of local authorities’ total estimated Revenue spending which and is used to calculate the level of funding that the Scottish Government gives to each local authority each year.
The method for funding local authorities is described in detail in a SPICe briefing paper for the Local Government and Regeneration Committee2, issued in March 2014.
In addition to funding from the Scottish Government, there are other sources of income to local government which are not taken into account when applying the funding formula. Net Revenue Expenditure, which the funding formula is based around, is Gross Revenue Expenditure, less other government grants, customer and client receipts, grants to third parties funded by General Capital Grant, and other grants, reimbursements and contributions. It is therefore the Net Revenue Expenditure that is to be financed from General Revenue Funding, non-domestic rates, Council Tax and balances3.
Draft Budget 2018-19 - Local government funding
Local government total allocations
The total allocation to local government in the 2018-19 Draft Budget is £10,384.1m. This is mostly made up of General Revenue Grant (GRG) and Non-Domestic Rates Income (NDRI), with smaller amounts for General Capital Grant and Specific (or ring-fenced) Revenue and Capital grants.
However, as noted elsewhere, this is not the full picture of the totality of funding for local authorities in the Draft Budget.
Once Revenue funding in other portfolios is included (as set out in the Finance Circular1), the "Total Core Local Government Settlement" is £10,507.1m.
And, if all funding outwith the local government finance settlement (but still from the Scottish Government to local authorities) is included, the total is £10,868.1m. Finally, if "other sources of support" (set out in table 10.13 in the Draft Budget 2018-19) are included the total rises to £11,334.1.
"Other sources of support" includes funding for Health and Social Care integration, which is in the Health budget, and additional income from Council Tax reform changes. The numbers for "other sources of support" in the budget tables do not include amounts Councils could raise by increasing Council Tax by 3%, although this facility was referred to by the Cabinet Secretary in his budget statement.
Funding figures are drawn from tables 10.12, 10.13, 10.19 and 10.20 of the Draft Budget 2018-19 document.
Of course, aside from government grant, Non-Domestic Rates Income, and income from the Council Tax, local authorities also receive a range of other income, mainly from sales, and fees and charges for services. However, while this is an important part of the bigger picture of local authority finance, it generally does not play a part in the annual budget process. In addition, amounts are not known until outturn data is available, often around a year after the end of the fiscal year in question.
Central and local government, and different political parties, will have different preferences for what to include when discussing funding for local government. In this briefing, as before, SPICe has set out how different figures are arrived at, to allow for the greatest transparency in parliamentary scrutiny.
Our approach
In the total allocations section, we set out the different totals for local government. However, in the remainder of this section of the briefing, which focuses on the year on year change figures, we concentrate on the numbers within the central local government budget - that is, the breakdown of the £10,384.1m figure in Table 10.13 of the Draft Budget, and the headline numbers in the Local Government Finance Circular
The Scottish Government guarantees the combined GRG and distributable NDRI figure, approved by Parliament, to each local authority. If NDRI is lower than forecast, this is compensated for by an increase in GRG and vice versa. Therefore, to calculate Local Government's Revenue settlement, the combined GRG + NDRI figure is used. Further detail on NDRI within the Draft Budget 2018-19 can be found in the SPICe briefing on taxation in the context of the 2018-19 Draft Budget (published on the same day as this briefing and available on the SPICe digital briefings hub).
This briefing, reflecting recent changes to the Budget process and in line with the Scottish Government's presentation, compares Draft Budget 2018-191 figures to those Draft Budget 2017-18 figures as amended at Stage 2 of the Budget process, and figures are given in both cash and real (2017-18), £million and percentage, terms.
Local government budget breakdown
| Local Government | 2017-18 | 2018-19 (cash) | Cash change | Cash change % | 2018-19 (real) | Real change | Real change % |
|---|---|---|---|---|---|---|---|
| General Revenue Grant | 6,627.8 | 6,608.5 | -19.3 | -0.3% | 6,512.3 | -115.5 | -1.7% |
| Non-Domestic Rates | 2,665.8 | 2,636.0 | -29.8 | -1.1% | 2,597.6 | -68.2 | -2.6% |
| Support for Capital | 653.1 | 598.4 | -54.7 | -8.4% | 589.7 | -63.4 | -9.7% |
| Specific Resource Grants | 210.9 | 263.2 | 52.3 | 24.8% | 259.4 | 48.5 | 23.0% |
| Specific Capital Grants | 133.4 | 278.0 | 144.6 | 108.4% | 274.0 | 140.6 | 105.4% |
| Total Level 2 | 10,291.0 | 10,384.1 | 93.1 | 0.9% | 10,232.9 | -58.1 | -0.6% |
| GRG+NDRI | 9,293.6 | 9,244.5 | -49.1 | -0.5% | 9,109.9 | -183.7 | -2.0% |
| GRG, NDRI and SRG | 9,504.5 | 9,507.7 | 3.2 | 0.0% | 9,369.3 | -135.2 | -1.4% |
| Total Capital | 786.5 | 876.4 | 89.9 | 11.4% | 863.6 | 77.1 | 9.8% |
The total allocation to local government in the 2018-19 Draft Budget is £10,384.1m a fall of 0.6% (-£58.1m) in real terms since 2017-18. This is mostly made up of General Revenue Grant (GRG) and Non-Domestic Rates Income (NDRI), with smaller amounts for General Capital Grant and Specific (or ring-fenced) Revenue and Capital grants. Broken down, this is as follows-
General Revenue Grant plus Non Domestic Rates Income falls by 0.5% (-£49.1m) in cash terms, or 2% (-£183.7m) in real terms between 2017-18 and 2018-19.
When Specific Revenue Grants are taken into account, there is a small cash increase in Total Revenue funding for 2018-19 (+£3.2m). In real terms, this results in a reduction of 1.4% (-£135.2m).
Total Capital funding, by comparison, increases by 11.4% (£89.9m) in cash terms, or 9.8% (£77.1m) in real terms. However, this increase is due to an increase in specific capital grants. General support for capital has reduced in cash and real terms.
Table 2 sets out the figures presented in the Local Government Finance Circular 5/20171 in real terms.
| 2017-18 (cash) (£m) | 2018-19 (cash) (£m) | Cash change (£m) | Cash change % | 2018-19 (real) (£m) | Real change (£m) | Real change % | |
|---|---|---|---|---|---|---|---|
| Total Revenue | 9,647.8 | 9,630.8 | -17.1 | -0.2% | 9,490.5 | -157.3 | -1.6% |
| Total Capital | 786.5 | 876.4 | 89.8 | 11.4% | 863.6 | 77.1 | 9.8% |
| Total Funding | 10,434.3 | 10,507.1 | 72.8 | 0.7% | 10,354.2 | -80.2 | -0.8% |
As noted in the transparency section of this briefing, the totals in the Local Government Finance Circular differ to those in the Draft Budget. These are reconciled in the new tables in the Draft Budget - there is £123m additional resource funding in the Circular compared to the Draft Budget. This means that "Total Revenue" is shown as falling by 0.2% in cash terms (-£17.1m) and by 1.6% in real terms (-£157.3m).
Local Government share of the Scottish Government Budget
In the briefing Local government finance: facts and figures 2010-11 to 2017-181, SPICe looked at local government's share of the Scottish Government Budget over the long-term. To ensure comparability, this was done on the basis of Resource + NDRI for the Revenue Budget, and Capital for the Capital Budget. Due to the wide variations year-on-year in Capital, Revenue and Capital figures were shown separately.
Looking at Revenue and Capital combined, local government's share of the Scottish Government Budget (based on Resource, Capital and NDRI) is 32.5%, fall of 0.5 percentage points since 2017-18. This is, in effect, a balancing out of a 0.6% fall in local government's share of the Scottish Government's Revenue Budget (25.7%), and a 0.8% rise in local government's share of the Scottish Government Capital Budget (31.8%).
Historical changes
The briefing, Local government finance: facts and figures 2010-11 to 2017-18 also looked at real terms change over time, comparing the local government settlement to the Scottish Government budget. Figure 2 updates the outturn data shown in Figure 3 from the facts and figures briefing.
Due to the removal of police and fire funding from the local government settlement in 2013-14 onwards, figures for 2010-11 to 2012-13 have been adjusted to remove specific grants for police and fire services. Further detail on this methodology, developed by Audit Scotland, can be found in the facts and figures briefing1. Updated figures for 2017-18 have been agreed with Audit Scotland, and a further breakdown of long term trends for individual local authorities will be included in the forthcoming 2018 SPICe facts and figures briefing.
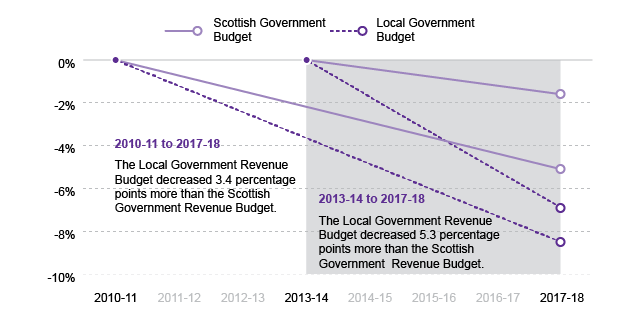
This updated figure shows that the real terms trends previously observed have continued-
Between 2010-11 and 2017-18, if the spend on police and fire services in 2010-11 to 2012-14 is adjusted out, the local government Revenue Budget fell at a steeper rate (-8.5%) than the Scottish Government Revenue Budget (-5.1%) (including Non-Domestic Rates Income on both sides).
Looking at the more comparable years between 2013-14 and 2017-18, the local government Revenue Budget fell by 6.9%, whereas the Scottish government Revenue Budget fell by only 1.6% (including Non-Domestic Rates Income on both sides).
Policy commitments
Commitments for 2018-19
As part of the Scottish Government's funding settlement, local authorities are expected to meet certain commitments in return for the full funding package. For 2017-18, local government was expected to maintain the pupil:teacher ratio at 2016 levels, and to secure places for all probationers under the teacher induction scheme. These commitments can have an effect on the funding available to local authorities to deliver core services.
The Local Government Finance Circular (5/2017)1 sets out the funding commitments for local authorities in 2018-19, summarised in Table 3 below.
| Commitment | Value | Where is it funded? |
|---|---|---|
| Early Years Education and Childcare | £52.2m | Specific Resource Grant |
| £150m | Specific Capital Grant | |
| £11m | Within General Resource Grant | |
| Teachers' pay in 2018-19 | £24m | Within General Resource Grant |
| Maintaining teacher numbers | £51m | Within General Resource Grant |
| Teachers' induction scheme | £37m | Within General Resource Grant |
| Health and Social Care | £66m | Within General Resource Grant |
While the commitments around early years education and childcare are funded as ring-fenced specific grants, other commitments which local authorities must agree to meet are funded within the general resource grant.
While this approach means that local government has more freedom over how to deliver these priorities, CoSLA have argued that including commitments such as these within overall presentation of the headline change in the local government budget means that the core Revenue Budget is, in effect, lower than a flat cash settlement23. In calculating its "cut of £153m for essential local government services", CoSLA takes the resource commitments for Early Learning and Childcare expansion (£52.2m and £11m), Health and Social Care (£66m) and teachers' pay (£24m), which together total £153m. CoSLA's rationale is that, as local government is required to fund these commitments, in their view, in reality "this is not a flat cash revenue settlement for local government."3
Council Tax
The ability to increase Council Tax by 3% was introduced upon the end of the Council Tax Freeze in 2017-18. At this point, twenty one councils opted to increase the Band D rate of Council Tax (against which all other Bands are set) by the full 3%. Three councils chose increases of 2% or 2.5%, and eight councils opted to apply no increase. The ability to raise Council Tax by 3% has again been granted to local authorities for 2018-19.
Based on the assumption that all councils would apply an increase in 2018-19, the Scottish Government detailed expected income of roughly £77m, the breakdown of which is detailed in Table 6 of the Annexe. In his statement to Parliament, the Cabinet Secretary stated that including this additional Council Tax money "would secure a real-terms increase in local government funding."1
Public sector pay cap
Alongside the Draft Budget 2018-19, the Scottish Government published its 2018-19 Public Sector Pay Policy1. This includes a 3% pay rise for all earning less than £30,000; caps the pay bill at 2% for all those earning more than £30,000; and limits the maximum pay uplift for those earning over £80,000 to £1,600.
The Public Sector Pay Policy applies directly to 44 Public Bodies, and the Scottish government state that-
This policy also acts as a benchmark for all major public sector workforce groups across Scotland including NHS Scotland, fire-fighters and police officers, teachers and further education workers. For local government employees, pay and other employment matters are delegated to local authorities.
Scottish Government. (2017, December 14). Public Sector Pay Policy for 2018-19. Retrieved from http://www.gov.scot/Publications/2017/12/3335 [accessed 14 December 2017]
SPICe notes that pay is delegated to local authorities and so the Government's pay policy does not apply to council employees. However, SPICe has estimated that, if local authorities were to match the Scottish Government's pay policy, this would cost around £150m in 2018-19.
These are total costs and do not reflect the costs that would have been incurred in awarding a 1% increase. When compared with the costs of implementing a 1% pay award, the additional costs are around £90m i.e. the new pay policy would cost £90m over and above the costs of a 1% pay settlement. These estimates relate only to the costs of the pay policy and take no account of any additional costs relating to pay progression (whereby staff progress through set pay bands on an annual basis, regardless of the basic pay settlement). They also assume no change in the mix of staff and take no account of adjustments that employers might make in order to maintain pay differentials between staff.
As noted in the budget breakdown section of this briefing, the funding available to local authorities for core services (GRG + NDRI) is due to fall by £49.1m in cash terms, and "Total Revenue" funding is increasing by £3.2m. Therefore, councils may face challenges in matching this pay policy commitment.
Allocations to local authorities
Local Government Finance Circular 5/20171 was published alongside the Draft Budget, and contains provisional allocations to local authorities.
In response to calls for greater transparency, figures presented in Local Government Finance Circular 5/2017 match those presented for the "Total Core Local Government Settlement" within the Draft Budget 2018-192 document, which was not the case in previous years. The circular also reflects increased reporting on reconciliations made in-year.
Allocations in the circular are provisional and subject to consultation, therefore local authorities should not set their final budgets on the basis of these figures. Any local authority not intending to agree the offer, and associated terms, must notify the Scottish Government by 19 January 2018. This is also the date by which any discrepancies identified by local authorities or CoSLA should be raised with the Scottish Government.
Consultation on the figures presented in the circular will take place between the Scottish Government and CoSLA in advance of the Local Government Finance (Scotland) Order 2018 being presented to the Scottish Parliament in late-February 2018. Final allocations will be published in a circular in late-February.
Provisional Revenue allocations
In order to account for reconciliation and re-profiling in-year, the Scottish Government provided further information setting out a breakdown of local government Revenue support on a like-for-like basis between 2017-18 and 2018-19. Real terms change figures represent these figures. It should be noted that there are significant funds still to be distributed in 2018-19, and therefore final figures will be higher.
Figures for per head allocations and percentage of the Scottish average are based on Total Revenue funding settlements, as set out in Column 12 of Annexe B of the Local Government Finance Circular.
Real terms change
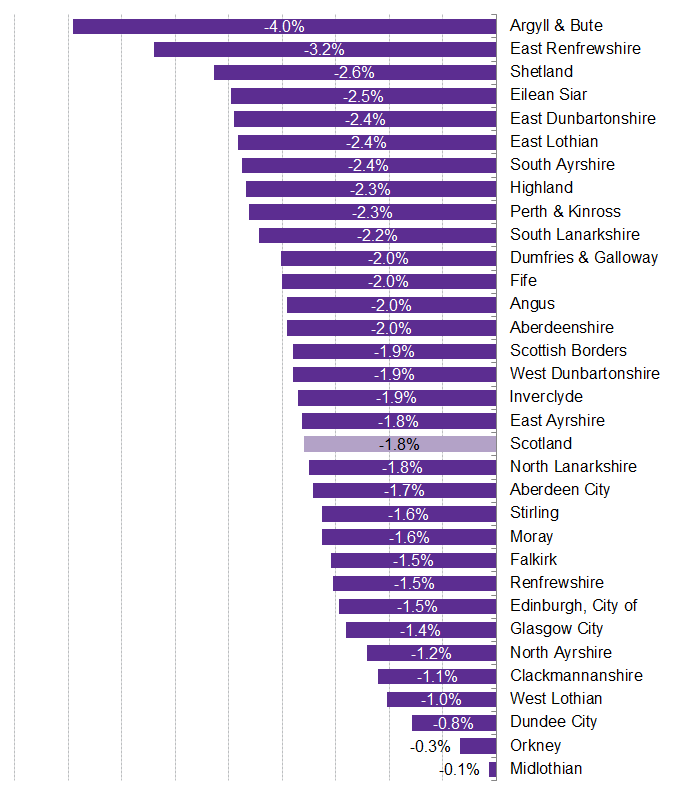
Figure 3 shows that Argyll and Bute Council faces a fall in Total Revenue funding of 4% in 2018-19, compared to a Scottish average of -1.8%. Midlothian Council sees the smallest impact on Total Revenue funding, of only -0.1%.
£ per head
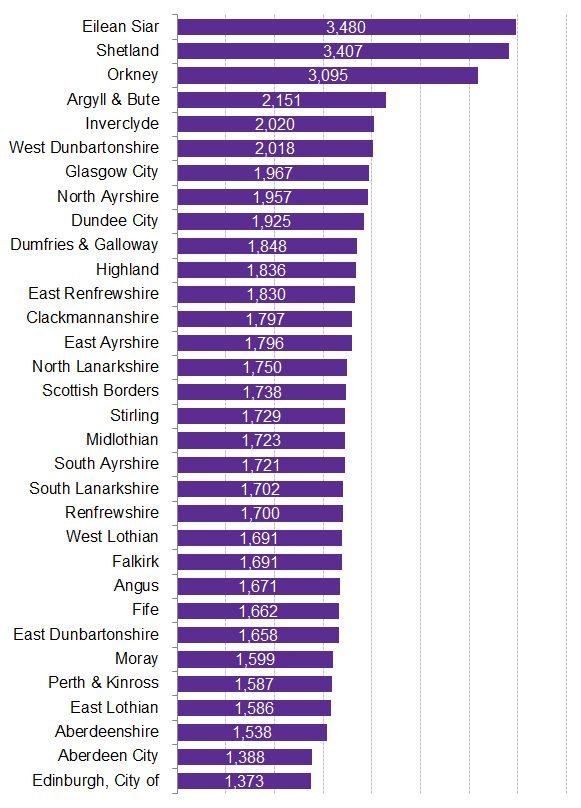
As in previous years, the three island authorities receive the greatest amount of Total Revenue funding per head, which reflects the application of the Special Islands Needs Allowance as set out in the local government funding formula1.
Aberdeenshire, Aberdeen City and the City of Edinburgh have the lowest allocations per head. As detailed in the SPICe briefing, The social impact of the 2017-18 local government budget2, these three councils all receive a high proportion of income from Council Tax (26% for Aberdeenshire and 29% for the other two councils) compared to the Scottish average of 22% which will have an impact on the Total Revenue funding provided by the Scottish Government.
The Scottish Government has made the commitment that no local authority will receive less than 85% of the Scottish average per head in terms of Revenue support. This includes funding from Council Tax income. The only local authority affected by this adjustment in 2018-19, as in per last year, is Aberdeen City.
Percentage of the Scottish average
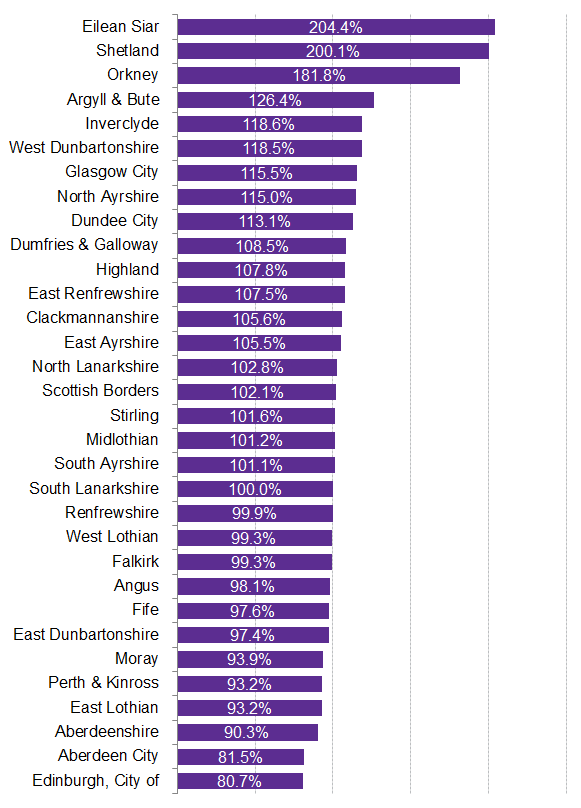
Figure 5 shows the data presented in Figure 4 in percentage terms. This shows that, at the highest level, Eilean Siar receives roughly 200% of the Scottish Government average for Total Revenue funding. Conversely, the City of Edinburgh receives 80.7% of the Scottish Government average for Total Revenue funding. However, as already noted, the "85% floor" is now calculated on the basis of Revenue funding plus Council Tax income.
Provisional Capital allocations
Figure 6 below shows the change from 2017-18 to 2018-19 in Capital allocations in real terms, A full breakdown of the figures, and the actual allocations for 2018-19, are in Table 5 of the annexe. These are presented for information only and figures should be treated with caution. The provisional distribution for the General Capital Grant is complicated as it includes allocations for flood schemes. Where schemes have slipped and the grant paid in a prior year exceeds the grant due, the scheme will show a negative value which will reduce the total General Capital Grant payable to that Council, hence some of the outlier figures in the chart below.
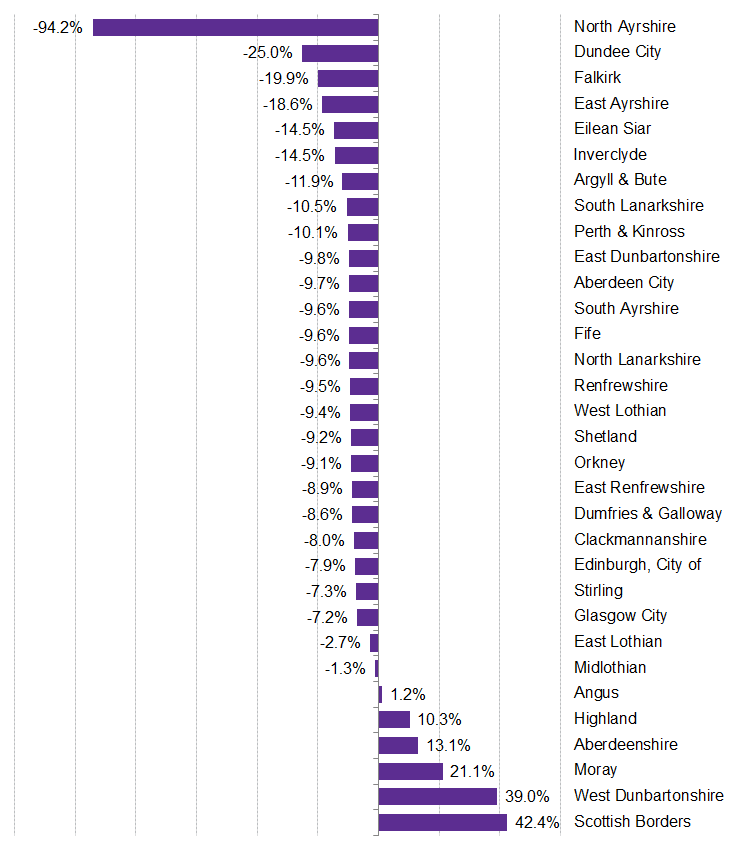
As Capital grants can vary widely year to year depending on planned infrastructure investment, looking at Capital funding over time does not show an accurate trend in local government investment, so these figures are purely illustrative.
Annexe
Table 1 - Local Government funding from Scottish Government (cash) and percentage share
| Revenue | Capital | Total | |||||||
|---|---|---|---|---|---|---|---|---|---|
| LG Total Revenue | SG Revenue Fiscal Resource Budget Limit + NDRI | LG as a % of SG | LG Total Capital** | SG Capital Budget Limit | LG as a % of SG | LG Total | SG total | LG as a % of SG | |
| 2010-11 | 9,439.6 | 27,692.2 | 34.1% | 472.2 | 3,335.0 | 14.2% | 9,911.8 | 31,027.2 | 31.9% |
| 2011-12 | 9,294.4 | 27,520.0 | 33.8% | 607.2 | 2,762.0 | 22.0% | 9,901.6 | 30,282.0 | 32.7% |
| 2012-13 | 9,384.2 | 27,832.0 | 33.7% | 450.8 | 2,676.0 | 16.8% | 9,835.0 | 30,508.0 | 32.2% |
| 2013-14 | 9,766.4 | 28,106.0 | 34.7% | 552.2 | 2,508.0 | 22.0% | 10,318.6 | 30,614.0 | 33.7% |
| 2014-15 | 9,920.6 | 28,457.5 | 34.9% | 839.0 | 2,690.0 | 31.2% | 10,759.7 | 31,147.5 | 34.5% |
| 2015-16 | 10,039.4 | 28,779.5 | 34.9% | 856.3 | 2,734.0 | 31.3% | 10,895.7 | 31,513.5 | 34.6% |
| 2016-17 | 9,707.9 | 28,856.5 | 33.6% | 606.9 | 2,891.0 | 21.0% | 10,314.8 | 31,747.5 | 32.5% |
| 2017-18 | 9,647.8 | 29,344.8 | 32.9% | 786.5 | 3,087.0 | 25.5% | 10,434.3 | 32,431.8 | 32.2% |
| % Change 2010-11 to 2017-18 | 2.2% | 6.0% | -1.2% | 66.5% | -7.4% | 11.3% | 5.3% | 4.5% | 0.2% |
| % Change 2013-14 to 2017-18 | -1.2% | 4.4% | -1.9% | 42.4% | 23.1% | 3.5% | 1.1% | 5.9% | -1.5% |
Source: Local Government Finance Circulars. Draft Budget 2015-16 (table 1.01), Draft Budget 2017-18 (table 1.01), Draft Budget 2018-19 (table 1.02)
* GRG + Specific and Other Revenue; 2010-11 to 2012-13 adjusted for P+F
** Gereral Capital + Specific Capital + Capital Funding to be distributed later or directly to SPT and Fire Boards. 2010-2011 to 2012-13
Table 2 - Local Government funding from Scottish Government (real 2017-18 prices) and percentage share
| Revenue | Capital | Total | |||||||
|---|---|---|---|---|---|---|---|---|---|
| LG Total Revenue | SG Revenue Fiscal Resource Budget Limit + NDRI | LG as a % of SG | LG Total Capital** | SG Capital Budget Limit | LG as a % of SG | LG Total | SG total | LG as a % of SG | |
| 2010-11 | 10,545.0 | 30,935.0 | 34.1% | 527.5 | 3,725.5 | 14.2% | 11,072.5 | 34,660.5 | 31.9% |
| 2011-12 | 10,235.3 | 30,306.0 | 33.8% | 668.7 | 3,041.6 | 22.0% | 10,904.0 | 33,347.6 | 32.7% |
| 2012-13 | 10,123.9 | 30,025.8 | 33.7% | 486.3 | 2,886.9 | 16.8% | 10,610.2 | 32,912.7 | 32.2% |
| 2013-14 | 10,359.3 | 29,812.2 | 34.7% | 585.7 | 2,660.2 | 22.0% | 10,945.0 | 32,472.4 | 33.7% |
| 2014-15 | 10,372.5 | 29,753.7 | 34.9% | 877.3 | 2,812.5 | 31.2% | 11,249.7 | 32,566.3 | 34.5% |
| 2015-16 | 10,426.5 | 29,889.2 | 34.9% | 889.3 | 2,839.4 | 31.3% | 11,315.8 | 32,728.6 | 34.6% |
| 2016-17 | 9,859.8 | 29,308.0 | 33.6% | 616.4 | 2,936.2 | 21.0% | 10,476.2 | 32,244.2 | 32.5% |
| 2017-18 | 9,647.8 | 29,344.8 | 32.9% | 786.5 | 3,087.0 | 25.5% | 10,434.3 | 32,431.8 | 32.2% |
| % Change 2010-11 to 2017-18 | -8.5% | -5.1% | -1.2% | 49.1% | -17.1% | 11.3% | -5.8% | -6.4% | 0.2% |
| % Change 2013-14 to 2017-18 | -6.9% | -1.6% | -1.9% | 34.3% | 16.0% | 3.5% | -4.7% | -0.1% | -1.5% |
Table 3 - Adjusted, provisional, "like for like" Revenue allocations, cash and real terms change
| Local Authority - like for like comparison | 2017-18 (cash) (adjusted) | 2018-19 (cash) (adjusted) | Cash change | Cash change % | 2018-19 (real) | Real change | Real change % |
|---|---|---|---|---|---|---|---|
| Aberdeen City | 309.3 | 308.5 | -0.8 | -0.3% | 304.0 | -5.3 | -1.7% |
| Aberdeenshire | 396.5 | 394.5 | -2.0 | -0.5% | 388.8 | -7.7 | -2.0% |
| Angus | 189.9 | 189.0 | -1.0 | -0.5% | 186.2 | -3.7 | -2.0% |
| Argyll & Bute | 186.5 | 181.8 | -4.7 | -2.5% | 179.1 | -7.4 | -4.0% |
| Clackmannanshire | 88.3 | 88.6 | 0.3 | 0.4% | 87.3 | -1.0 | -1.1% |
| Dumfries & Galloway | 268.6 | 267.1 | -1.5 | -0.6% | 263.2 | -5.4 | -2.0% |
| Dundee City | 270.6 | 272.4 | 1.8 | 0.7% | 268.5 | -2.1 | -0.8% |
| East Ayrshire | 210.6 | 209.8 | -0.8 | -0.4% | 206.8 | -3.8 | -1.8% |
| East Dunbartonshire | 175.4 | 173.6 | -1.8 | -1.0% | 171.1 | -4.3 | -2.4% |
| East Lothian | 161.3 | 159.8 | -1.6 | -1.0% | 157.4 | -3.9 | -2.4% |
| East Renfrewshire | 170.8 | 167.7 | -3.0 | -1.8% | 165.3 | -5.5 | -3.2% |
| Edinburgh, City of | 669.5 | 669.4 | -0.1 | 0.0% | 659.7 | -9.8 | -1.5% |
| Eilean Siar | 93.1 | 92.1 | -1.0 | -1.0% | 90.8 | -2.3 | -2.5% |
| Falkirk | 261.1 | 260.8 | -0.2 | -0.1% | 257.0 | -4.0 | -1.5% |
| Fife | 597.2 | 593.8 | -3.3 | -0.6% | 585.2 | -12.0 | -2.0% |
| Glasgow City | 1,137.3 | 1,137.8 | 0.6 | 0.0% | 1,121.3 | -16.0 | -1.4% |
| Highland | 421.6 | 417.8 | -3.8 | -0.9% | 411.7 | -9.8 | -2.3% |
| Inverclyde | 153.8 | 153.1 | -0.6 | -0.4% | 150.9 | -2.9 | -1.9% |
| Midlothian | 145.3 | 147.4 | 2.1 | 1.4% | 145.2 | -0.1 | -0.1% |
| Moray | 149.8 | 149.6 | -0.3 | -0.2% | 147.4 | -2.4 | -1.6% |
| North Ayrshire | 253.1 | 253.7 | 0.6 | 0.2% | 250.0 | -3.1 | -1.2% |
| North Lanarkshire | 571.5 | 569.8 | -1.7 | -0.3% | 561.5 | -10.0 | -1.8% |
| Orkney | 66.1 | 66.8 | 0.8 | 1.1% | 65.8 | -0.2 | -0.3% |
| Perth & Kinross | 234.3 | 232.3 | -2.0 | -0.9% | 228.9 | -5.4 | -2.3% |
| Renfrewshire | 286.0 | 285.8 | -0.2 | -0.1% | 281.6 | -4.4 | -1.5% |
| Scottish Borders | 194.3 | 193.4 | -0.9 | -0.4% | 190.6 | -3.7 | -1.9% |
| Shetland | 79.3 | 78.3 | -1.0 | -1.2% | 77.2 | -2.1 | -2.6% |
| South Ayrshire | 186.5 | 184.7 | -1.7 | -0.9% | 182.1 | -4.4 | -2.4% |
| South Lanarkshire | 523.0 | 519.0 | -4.0 | -0.8% | 511.4 | -11.6 | -2.2% |
| Stirling | 158.0 | 157.8 | -0.3 | -0.2% | 155.5 | -2.6 | -1.6% |
| West Dunbartonshire | 172.9 | 172.1 | -0.8 | -0.4% | 169.6 | -3.3 | -1.9% |
| West Lothian | 293.2 | 294.5 | 1.3 | 0.4% | 290.2 | -3.0 | -1.0% |
| Scotland | 9,074.5 | 9,043.0 | -31.5 | -0.3% | 8,911.4 | -163.2 | -1.8% |
Table 4 - Provisional Revenue allocations - per head
| 2018-19 actual | 2016 mid year population | Per head | % of scottish average | |
|---|---|---|---|---|
| Aberdeen City | 319.002 | 229,840 | 1,388 | 79.8% |
| Aberdeenshire | 403.276 | 262,190 | 1,538 | 88.4% |
| Angus | 194.688 | 116,520 | 1,671 | 96.1% |
| Argyll & Bute | 187.451 | 87,130 | 2,151 | 123.7% |
| Clackmannanshire | 92.288 | 51,350 | 1,797 | 103.3% |
| Dumfries & Galloway | 276.266 | 149,520 | 1,848 | 106.2% |
| Dundee City | 285.459 | 148,270 | 1,925 | 110.7% |
| East Ayrshire | 219.455 | 122,200 | 1,796 | 103.3% |
| East Dunbartonshire | 178.335 | 107,540 | 1,658 | 95.3% |
| East Lothian | 165.104 | 104,090 | 1,586 | 91.2% |
| East Renfrewshire | 171.700 | 93,810 | 1,830 | 105.2% |
| Edinburgh, City of | 696.574 | 507,170 | 1,373 | 79.0% |
| Eilean Siar | 93.609 | 26,900 | 3,480 | 200.1% |
| Falkirk | 269.510 | 159,380 | 1,691 | 97.2% |
| Fife | 615.603 | 370,330 | 1,662 | 95.6% |
| Glasgow City | 1,209.707 | 615,070 | 1,967 | 113.1% |
| Highland | 430.946 | 234,770 | 1,836 | 105.5% |
| Inverclyde | 159.870 | 79,160 | 2,020 | 116.1% |
| Midlothian | 152.678 | 88,610 | 1,723 | 99.1% |
| Moray | 153.621 | 96,070 | 1,599 | 91.9% |
| North Ayrshire | 265.993 | 135,890 | 1,957 | 112.5% |
| North Lanarkshire | 594.032 | 339,390 | 1,750 | 100.6% |
| Orkney | 67.615 | 21,850 | 3,095 | 177.9% |
| Perth & Kinross | 239.094 | 150,680 | 1,587 | 91.2% |
| Renfrewshire | 299.095 | 175,930 | 1,700 | 97.7% |
| Scottish Borders | 199.095 | 114,530 | 1,738 | 99.9% |
| Shetland | 79.034 | 23,200 | 3,407 | 195.9% |
| South Ayrshire | 193.576 | 112,470 | 1,721 | 99.0% |
| South Lanarkshire | 539.756 | 317,100 | 1,702 | 97.9% |
| Stirling | 162.116 | 93,750 | 1,729 | 99.4% |
| West Dunbartonshire | 181.309 | 89,860 | 2,018 | 116.0% |
| West Lothian | 304.660 | 180,130 | 1,691 | 97.2% |
| Scotland | 9,400.517 | 5,404,700 | 1,739 | 100.0% |
Table 5 - Provisional Capital allocations
| Total Capital funding | 2017-18 | Total general Capital grant payable | Specific Capital grants - settlement | Total Capital funding (2018-19) | Cash change | Cash change % | 2018-19 (real) | Real change | Real change % |
|---|---|---|---|---|---|---|---|---|---|
| Aberdeen City | 26.2 | 23.7 | 0.3 | 24.0 | -2.2 | -8.4% | 23.6 | -2.5 | -9.7% |
| Aberdeenshire | 32.7 | 37.1 | 0.4 | 37.5 | 4.8 | 14.8% | 36.9 | 4.3 | 13.1% |
| Angus | 12.4 | 12.6 | 0.2 | 12.8 | 0.3 | 2.7% | 12.6 | 0.2 | 1.2% |
| Argyll & Bute | 14.6 | 12.9 | 0.1 | 13.1 | -1.6 | -10.6% | 12.9 | -1.7 | -11.9% |
| Clackmannanshire | 5.9 | 5.4 | 0.1 | 5.5 | -0.4 | -6.7% | 5.4 | -0.5 | -8.0% |
| Dumfries & Galloway | 23.6 | 21.7 | 0.2 | 21.9 | -1.7 | -7.3% | 21.6 | -2.0 | -8.6% |
| Dundee City | 26.8 | 20.2 | 0.2 | 20.4 | -6.4 | -23.9% | 20.1 | -6.7 | -25.0% |
| East Ayrshire | 15.6 | 12.7 | 0.2 | 12.9 | -2.7 | -17.4% | 12.7 | -2.9 | -18.6% |
| East Dunbartonshire | 10.6 | 9.6 | 0.1 | 9.7 | -0.9 | -8.5% | 9.6 | -1.0 | -9.8% |
| East Lothian | 12.4 | 12.1 | 0.1 | 12.2 | -0.2 | -1.3% | 12.0 | -0.3 | -2.7% |
| East Renfrewshire | 7.9 | 7.2 | 0.1 | 7.3 | -0.6 | -7.5% | 7.2 | -0.7 | -8.9% |
| Edinburgh, City of | 83.5 | 49.4 | 28.6 | 78.0 | -5.4 | -6.5% | 76.9 | -6.6 | -7.9% |
| Eilean Siar | 9.3 | 8.1 | 0.0 | 8.1 | -1.2 | -13.3% | 8.0 | -1.4 | -14.5% |
| Falkirk | 18.2 | 14.6 | 0.2 | 14.8 | -3.4 | -18.7% | 14.6 | -3.6 | -19.9% |
| Fife | 37.8 | 32.7 | 2.0 | 34.7 | -3.1 | -8.3% | 34.2 | -3.6 | -9.6% |
| Glasgow City | 144.5 | 68.0 | 68.1 | 136.1 | -8.4 | -5.8% | 134.1 | -10.3 | -7.2% |
| Highland | 36.9 | 41.0 | 0.3 | 41.3 | 4.4 | 11.9% | 40.7 | 3.8 | 10.3% |
| Inverclyde | 9.7 | 8.3 | 0.1 | 8.4 | -1.3 | -13.2% | 8.3 | -1.4 | -14.5% |
| Midlothian | 9.9 | 9.8 | 0.1 | 9.9 | 0.0 | 0.2% | 9.8 | -0.1 | -1.3% |
| Moray | 8.9 | 10.8 | 0.1 | 11.0 | 2.0 | 22.9% | 10.8 | 1.9 | 21.1% |
| North Ayrshire | 32.4 | 0.0 | 1.9 | 1.9 | -30.5 | -94.2% | 1.9 | -30.5 | -94.2% |
| North Lanarkshire | 35.6 | 29.8 | 2.9 | 32.6 | -2.9 | -8.2% | 32.1 | -3.4 | -9.6% |
| Orkney | 7.0 | 6.4 | 0.0 | 6.4 | -0.5 | -7.8% | 6.3 | -0.6 | -9.1% |
| Perth & Kinross | 18.7 | 16.8 | 0.2 | 17.0 | -1.6 | -8.8% | 16.8 | -1.9 | -10.1% |
| Renfrewshire | 17.8 | 16.1 | 0.2 | 16.3 | -1.5 | -8.2% | 16.1 | -1.7 | -9.5% |
| Scottish Borders | 18.2 | 26.1 | 0.2 | 26.3 | 8.1 | 44.5% | 25.9 | 7.7 | 42.4% |
| Shetland | 7.2 | 6.6 | 0.0 | 6.6 | -0.6 | -7.8% | 6.5 | -0.7 | -9.2% |
| South Ayrshire | 12.2 | 11.1 | 0.2 | 11.2 | -1.0 | -8.3% | 11.1 | -1.2 | -9.6% |
| South Lanarkshire | 31.8 | 27.6 | 1.3 | 28.9 | -2.9 | -9.1% | 28.5 | -3.3 | -10.5% |
| Stirling | 11.4 | 10.6 | 0.1 | 10.7 | -0.7 | -5.9% | 10.6 | -0.8 | -7.3% |
| West Dunbartonshire | 10.3 | 14.5 | 0.1 | 14.6 | 4.3 | 41.1% | 14.4 | 4.0 | 39.0% |
| West Lothian | 16.6 | 15.0 | 0.2 | 15.3 | -1.3 | -8.0% | 15.0 | -1.6 | -9.4% |
| Undistributed | 0.0 | 0.0 | 150.0 | 150.0 | 150.0 | 147.8 | 147.8 | ||
| Total | 766.4 | 598.3 | 259.0 | 857.3 | 90.9 | 11.9% | 844.8 | 78.5 | 10.2% |
| SPT | 20.1 | 19.0 | 19.0 | -1.1 | -5.5% | 18.8 | -1.4 | -6.8% | |
| Total | 786.5 | 598.3 | 278.1 | 876.4 | 89.8 | 11.4% | 863.6 | 77.1 | 9.8% |
Table 6 - Predicted Council Tax income from 3% increase, 2018-19
| Local Authority | 2018-19 Potential Council Tax Increase, based on 3% increase, £ million |
|---|---|
| Aberdeen City | 3.566 |
| Aberdeenshire | 4.055 |
| Angus | 1.510 |
| Argyll & Bute | 1.510 |
| Clackmannanshire | 0.719 |
| Dumfries & Galloway | 2.022 |
| Dundee City | 1.867 |
| East Ayrshire | 1.626 |
| East Dunbartonshire | 1.849 |
| East Lothian | 1.582 |
| East Renfrewshire | 1.550 |
| Edinburgh, City of | 8.191 |
| Eilean Siar | 0.319 |
| Falkirk | 2.028 |
| Fife | 4.992 |
| Glasgow City | 8.365 |
| Highland | 3.638 |
| Inverclyde | 1.052 |
| Midlothian | 1.362 |
| Moray | 1.240 |
| North Ayrshire | 1.863 |
| North Lanarkshire | 3.981 |
| Orkney Islands | 0.268 |
| Perth & Kinross | 2.394 |
| Renfrewshire | 2.517 |
| Scottish Borders | 1.677 |
| Shetland Islands | 0.280 |
| South Ayrshire | 1.788 |
| South Lanarkshire | 4.217 |
| Stirling | 1.451 |
| West Dunbartonshire | 1.226 |
| West Lothian | 2.241 |
| Scotland | 76.945 |
Abbreviations
CoSLA - Convention of Scottish Local Authorities
DB - Draft Budget
DEL - Departmental Expenditure Limit
GAE - Grant Aided Expenditure
GRG - General Revenue Grant
LG - Local Government
NDRI - Non-Domestic Rates Income
OT - Outturn
P+F - Police and Fire
SG - Scottish Government
TEE - Total Estimated Expenditure
Related Briefings
SB 16/07 - Local Government Funding: Draft Budget 2016-17 and provisional allocations to local authorities
SB 16/103 - Scottish Government Draft Budget 2017-18
SB 17/44 - Local Government Finance: Facts and Figures 2010-11 to 2017-18
SB 17/82 - Local Government Finance: Fees and Charges 2011-12 to 2015-16
SB 17/83 - The social impact of the 2017-18 local government budget
Sources
Campbell, A. (2016, January 21). SB 16-07 Local Government Funding: Draft Budget 2016-17 and provisional allocations to local authorities. Retrieved from <a href="http://www.parliament.scot/ResearchBriefingsAndFactsheets/S4/SB_16-07_Local_Government_Funding-_Draft_Budget_2016-17_and_provisional_allocations_to_local_authorities.pdf" target="_blank">http://www.parliament.scot/ResearchBriefingsAndFactsheets/S4/SB_16-07_Local_Government_Funding-_Draft_Budget_2016-17_and_provisional_allocations_to_local_authorities.pdf</a> [accessed 15 December 2017]
Financial Scrutiny Unit. (2016, December 19). SB 16-103 Scottish Government Draft Budget 2017-18. Retrieved from <a href="http://www.scottish.parliament.uk/ResearchBriefingsAndFactsheets/S5/SB_16-103_Draft_Budget_2017-18.pdf" target="_blank">http://www.scottish.parliament.uk/ResearchBriefingsAndFactsheets/S5/SB_16-103_Draft_Budget_2017-18.pdf</a> [accessed 4 December 2017]
Scottish Parliament Local Government and Communities Committee. (2017, January 27). Report on the Scottish Government’s Draft Budget 2017-18. Retrieved from <a href="http://www.parliament.scot/S5_Local_Gov/Reports/LGCS052017R02.pdf" target="_blank">http://www.parliament.scot/S5_Local_Gov/Reports/LGCS052017R02.pdf</a> [accessed 15 June 2017]
Scottish Government. (2017, March 9). Scottish Government Response to the Local Government and Communities Committee's Report on the Draft Budget 2017-18. Retrieved from <a href="http://www.parliament.scot/S5_Local_Gov/Inquiries/20170309_DraftBudgetReportSGResponse.pdf" target="_blank">http://www.parliament.scot/S5_Local_Gov/Inquiries/20170309_DraftBudgetReportSGResponse.pdf</a> [accessed 14 December 2017]
Budget Process Review Group. (2017, June 30). Final Report. Retrieved from <a href="http://www.parliament.scot/S5_Finance/Reports/BPRG_-_Final_Report_30.06.17.pdf" target="_blank">http://www.parliament.scot/S5_Finance/Reports/BPRG_-_Final_Report_30.06.17.pdf</a> [accessed 13 December 2017]
Scottish Government. (2017, March 9). 'Green Book' for Grant Aided Expenditure. Retrieved from <a href="http://www.gov.scot/Resource/0051/00515060.pdf" target="_blank">http://www.gov.scot/Resource/0051/00515060.pdf</a> [accessed 13 December 2017]
Berthier, A. (2014, April 23). Local Government Revenue Funding Allocations. Retrieved from <a href="http://www.scottish.parliament.uk/S4_LocalGovernmentandRegenerationCommittee/Meeting%20Papers/20140423-Papers.pdf" target="_blank">http://www.scottish.parliament.uk/S4_LocalGovernmentandRegenerationCommittee/Meeting%20Papers/20140423-Papers.pdf</a> [accessed 13 December 2017]
Scottish Government. (2017, February 28). Scottish Local Government Finance Statistics 2015-16. Retrieved from <a href="http://www.gov.scot/Publications/2017/02/1688" target="_blank">http://www.gov.scot/Publications/2017/02/1688</a> [accessed 13 December 2017]
Scottish Government. (2017, December 14). Local Government Finance Circular 5/2017. Retrieved from <a href="http://www.gov.scot/Resource/0052/00529327.pdf" target="_blank">http://www.gov.scot/Resource/0052/00529327.pdf</a> [accessed 14 December 2017]
Scottish Government. (2017). Scottish Budget: Draft Budget 2018-19. Retrieved from <a href="http://www.gov.scot/Resource/0052/00529171.pdf" target="_blank">http://www.gov.scot/Resource/0052/00529171.pdf</a>
Burn-Murdoch, A. (2017, June 21). Local Government finance: facts and figures 2011-12 to 2017-18. Retrieved from <a href="https://digitalpublications.parliament.scot/ResearchBriefings/Report/2017/6/21/Local-Government-Finance--facts-and-figures-2010-11-to-2017-18#" target="_blank">https://digitalpublications.parliament.scot/ResearchBriefings/Report/2017/6/21/Local-Government-Finance--facts-and-figures-2010-11-to-2017-18#</a> [accessed 23 November 2017]
CoSLA. (2017, November). Submission to the Local Government and Communities Committee: Fair Funding for Essential Services. Retrieved from <a href="http://www.parliament.scot/S5_Local_Gov/Inquiries/20171113_Budget_COSLA.pdf" target="_blank">http://www.parliament.scot/S5_Local_Gov/Inquiries/20171113_Budget_COSLA.pdf</a> [accessed 23 November 2017]
CoSLA. (2017, December 14). Budget Response from CoSLA. Retrieved from <a href="http://www.cosla.gov.uk/news/2017/12/budget-response-cosla" target="_blank">http://www.cosla.gov.uk/news/2017/12/budget-response-cosla</a> [accessed 14 December 2017]
Scottish Parliament Official Report. (2017, December 14). Meeting of the Parliament, 14 December 2017. Retrieved from <a href="http://www.parliament.scot/parliamentarybusiness/report.aspx?r=11263&i=102605" target="_blank">http://www.parliament.scot/parliamentarybusiness/report.aspx?r=11263&i=102605</a> [accessed 18 December 2017]
Scottish Government. (2017, December 14). Public Sector Pay Policy for 2018-19. Retrieved from <a href="http://www.gov.scot/Publications/2017/12/3335" target="_blank">http://www.gov.scot/Publications/2017/12/3335</a> [accessed 14 December 2017]
Scottish Government. (2017, December 14). Scottish Government Draft Budget 2018-19. Retrieved from <a href="http://www.gov.scot/Publications/2017/12/8959" target="_blank">http://www.gov.scot/Publications/2017/12/8959</a> [accessed 14 December 2017]
Gannon, M., Burn-Murdoch, A., Aiton, A., Bailey, N., Bramley, G., Campbell, A., … Hastings, A. (2017, December 5). The social impact of the 2017-18 local government budget. Retrieved from <a href="https://digitalpublications.parliament.scot/ResearchBriefings/Report/2017/12/5/The-social-impact-of-the-2017-18-local-government-budget#" target="_blank">https://digitalpublications.parliament.scot/ResearchBriefings/Report/2017/12/5/The-social-impact-of-the-2017-18-local-government-budget#</a> [accessed 15 December 2017]